Intelligent Investment
2026 Senior Housing Development Costs
July 8, 2026 4 Minute Read
Developer Survey Results
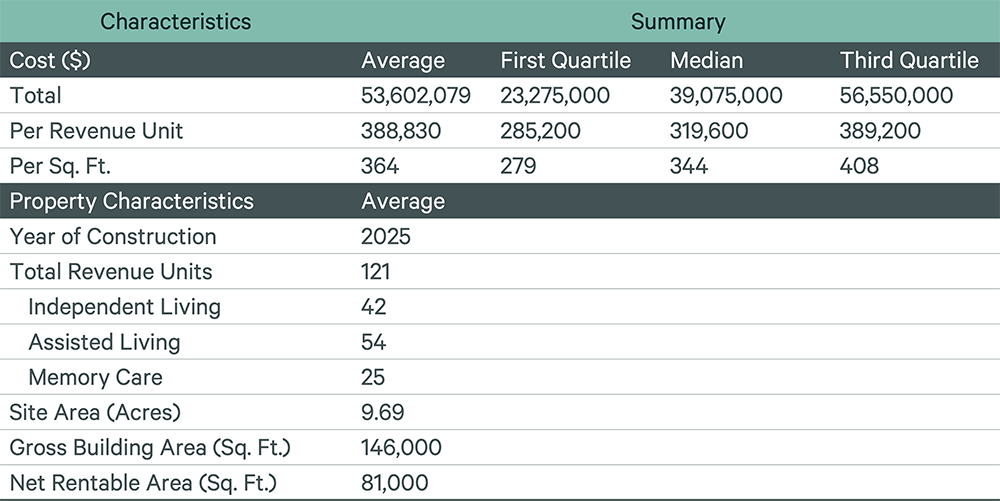
CBRE’s Senior Housing Development Costs survey was last conducted in 2023 due to the limited number of projects in 2024 and 2025. Since then, construction costs have increased significantly. From Q3 2023 to Q2 2026, the average cost of senior housing development rose to $388,830 per revenue unit or $364 per sq. ft. The average net rentable area of the 36 projects surveyed by CBRE was 55.5% of gross building area, down from 59.1% in 2023.
Hard costs represented 72.5% of total development cost, followed by soft costs at 16.2% and site acquisition costs at 8.1%. Return on cost averaged 8.1%.
Figure 1: Developer Survey Results
Site Acquisition Costs
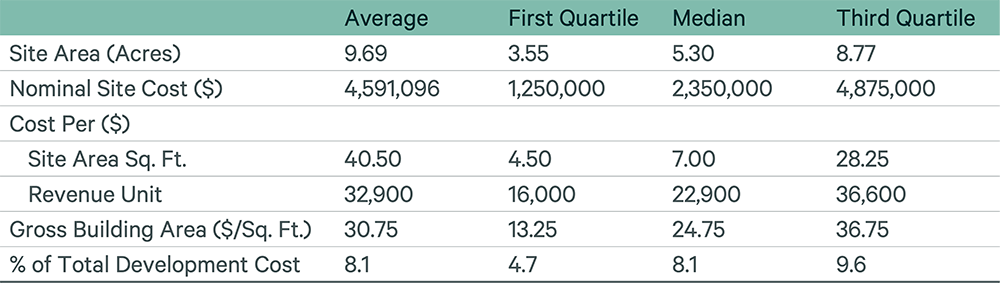
For fully permitted projects, site acquisition costs averaged $30.75 per sq. ft. of gross building area, representing 8.1% of total development cost. Site costs for most developments ranged from $16,000 to $36,600 per revenue unit. The main factors influencing site costs include area density, local regulations and demographic trends.
Figure 2: Site Acquisition Costs
Source: CBRE Valuation & Advisory Services, CBRE Research, Q2 2026.
Hard Costs
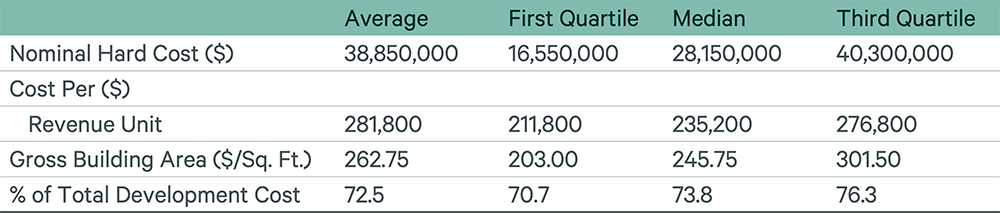
Hard costs represented the largest portion of development spending. They averaged $262.75 per sq. ft. of gross building area, representing 72.5% of total development cost. Hard costs include sitework, foundation work, building shell construction, roofing, finishes, landscaping, signage and labor.
Figure 3: Hard Costs
Source: CBRE Valuation & Advisory Services, CBRE Research, Q2 2026.
Soft Costs
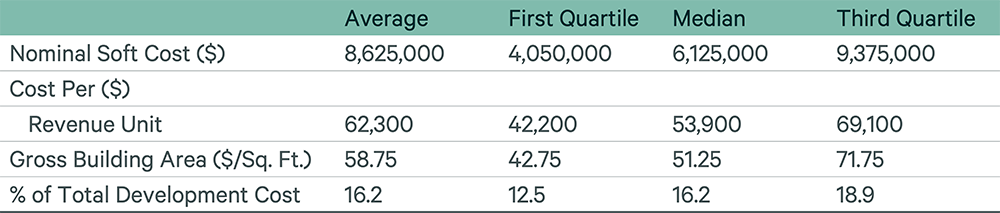
Soft costs edged down since the prior survey, averaging $58.75 per sq. ft. of gross building area or 16.2% of total development cost. These costs cover inspection fees, construction loan expenses, architecture, design, project management and any other carrying costs during construction and leasing.
Figure 4: Soft Costs
Source: CBRE Valuation & Advisory Services, CBRE Research, Q2 2026.
FF&E Costs
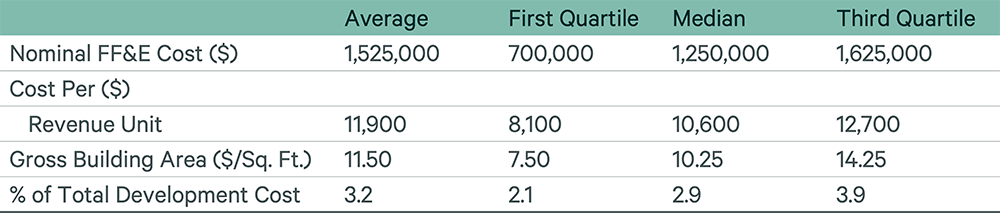
Furniture, fixtures & equipment (FF&E) costs surged since the prior survey, averaging $11,900 per revenue unit or 3.2% of total development cost. FF&E are not a permanent part of the building, so not always included in development costs.
Figure 5: FF&E Costs
Source: CBRE Valuation & Advisory Services, CBRE Research, Q2 2026.
Return on Cost
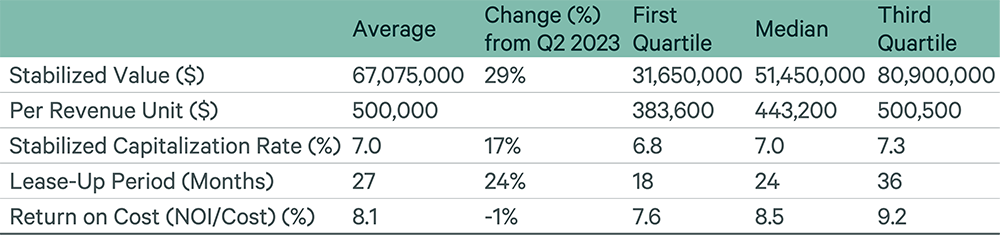
CBRE measures return on cost using stabilized net operating income as a percentage of total development costs. Cap rates on stabilized assets rose to 7% in Q2 from 6% in Q2 2023, dropping return on cost to 8.1% from 8.2%.
Stabilized value reflects inflation-adjusted dollars as of the date of stabilization. Development costs reflect current dollars and include operating shortfalls during the lease-up period. Stabilized cap rates represent market-supported and data-driven estimates rather than transaction data.
Figure 6: Return on Cost
Source: CBRE Valuation & Advisory Services, CBRE Research, Q2 2026.
Senior Housing Development Cost Examples
Figure 7: First Quartile Asset Summary (Low Range)
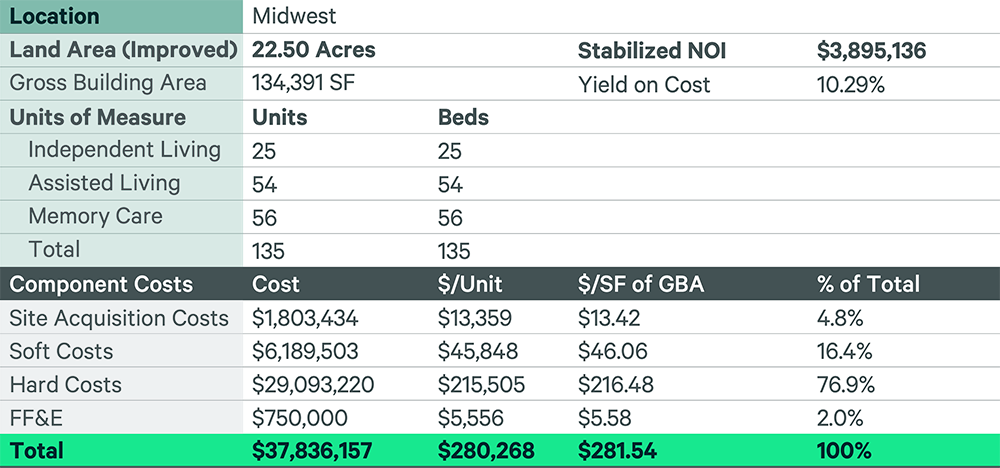
Figure 8: Median Asset Summary (Mid Range)
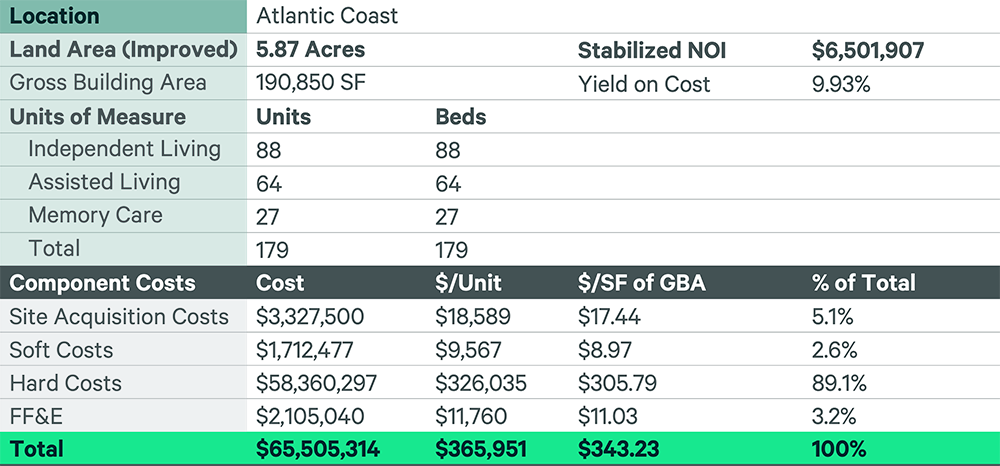
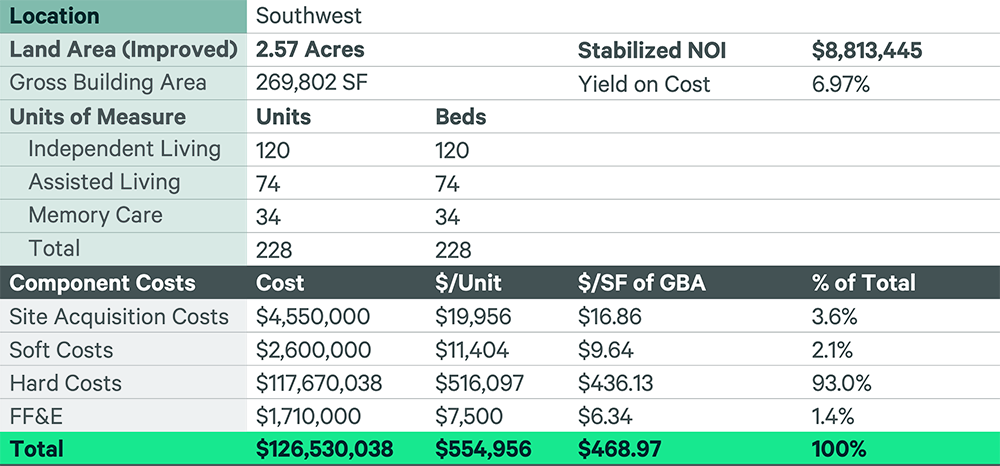
Figure 9: Third Quartile Asset Summary (High Range)
Related Insights
-
CBRE's H1 2026 Senior Housing Survey finds cap rates falling across all segments amid rising investor confidence.
-
Multifamily investment volume rises 9% YoY, driven by improved buyer sentiment for core acquisitions. CBRE's Q4 Multifamily Underwriting Survey reveals key trends and market insights.
-

Berlin office leasing market maintains strong momentum in the third quarter
Related Services
We offer a fully integrated platform of dedicated senior housing investment sales, debt and structured finance, investment banking, and valuation serv...
- Invest, Finance & Value
Valuation & Advisory Services
Gain accurate insights on your property value from our experts across valuations, appraisals and advisory services, globally.
CBRE Research

Valuation & Advisory Services
Daniel Lincoln, MAI
VAS Executive Vice President

Andy Kepchar, MAI
VAS Executive Vice President