Intelligent Investment
3PLs Dominate Top 100 Industrial Leases in H1 2025
August 11, 2025 3 Minute Read

The largest industrial leases of 1 million sq. ft. or more in H1 2025 were notably fewer than last year, as occupiers became more selective and less expansion-minded. Only 13 mega leases totaling 15.6 million sq. ft. were completed in H1, less than half of the 31 such deals totaling 34.5 million sq. ft. in H1 2024.
Total volume of the top 100 industrial leases in H1 fell to 71.8 million sq. ft. from 81.4 million sq. ft. in H1 2024. The average lease size of the top 100 also declined, dropping to 718,000 from 814,000 sq. ft. a year ago. Industrial occupiers appear to be making smaller commitments this year amid higher rents. Thirty-eight of the top 100 leases were renewals, slightly less than the 41 recorded in H1 2024.
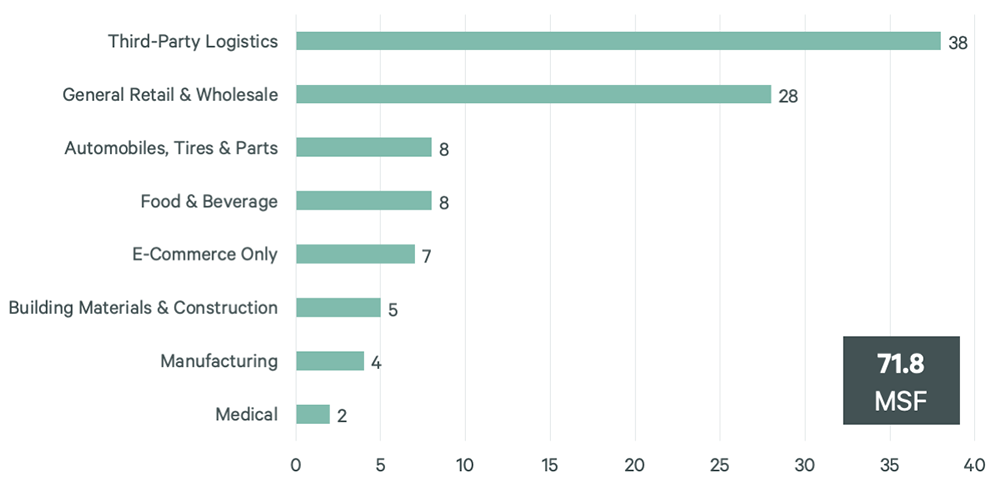
The distribution of leases signed by occupier type shifted noticeably in H1 2025. Third-party logistics providers (3PLs) dominated the top 100 with 38 leases totaling 28.9 million sq. ft., up from 28 leases totaling 20.6 million sq. ft. in H1 2024. Their share grew as more retailers and manufacturers outsourced warehousing and distribution operations. General retail and wholesale tenants, which had the biggest share of top 100 leases in H1 last year, fell to second place with 28 leases totaling 21.4 million sq. ft. this year.
Demand by e-commerce-only tenants dropped significantly, with just seven leases totaling 4.7 million sq. ft. This was a steep decline from their 31 leases totaling 13.2 million sq. ft. in H1 2024. The drop-off reflects broader restructuring across the e-commerce sector, with many firms continuing to scale back after a period of rapid growth.
Figure 1: Industry Share of Top 100 Industrial Leases in H1 2025
Geographically, the Inland Empire led with 14 leases totaling 9.8 million sq. ft. The PA I-78/I-81 Corridor followed with nine leases totaling 6.3 million sq. ft., while Dallas-Fort Worth ranked third with seven leases totaling 5.8 million sq. ft. These markets remain critical distribution hubs, supported by strong transportation access and logistics infrastructure.
Looking ahead, leasing momentum is expected to remain muted this year. Higher borrowing costs, cautious corporate spending and a limited number of large active requirements are reducing deal volume. However, this could change in 2026 as interest rates moderate and the development pipeline tightens, which may begin to put upward pressure on rents for large, modern facilities in core markets.
Figure 2: Leading Markets for Top 100 Lease Transactions in 2024

Industrial & Logistics
Contacts
John Morris
Group President, Leasing, Advisory Services


