Future Cities
Census data highlights shifts in population migration, housing patterns
Chart of the Week
May 7, 2024 2 Minute Read

Receive EA Insights Directly in your Inbox
New data from the Census Bureau highlights trends we reported on a few weeks ago, namely that domestic population movement is reverting to pre-COVID trends.
To illustrate, we’ve grouped similarly situated cities into four categories (Figure 1). This reveals that high-cost, densely populated Gateway Cities (e.g., New York, Los Angeles) have largely shaken off their pandemic travails and are on the cusp of returning to population growth. A big reason is that lower-cost housing markets have lost some of their allure. Amid sharply higher borrowing costs, now is not the best time to try to dispose of an existing home and purchase another in a far-off location.
This is also apparent from slowing in-migration to high-growth Sun Belt cities, which fell nearly 30% in 2023. It is not only Gateway city residents who find the Sun Belt less appealing. Midwesterners who once favored the Sun Belt’s economic dynamism are increasingly being persuaded to stay put by low unemployment and relatively inexpensive housing.
The Mountain West (e.g., Denver, Phoenix, Boise) has seen a more pronounced fall-off in in-migration, as relatively high housing prices deter would-be relocators. In 2023, immigration contributed more to population growth than did domestic population inflows. This uptick in immigration has benefited local multifamily rental and labor markets in many U.S. cities.
Figure 1: Components of Annual Population Change per One Million Residents by Metro Type
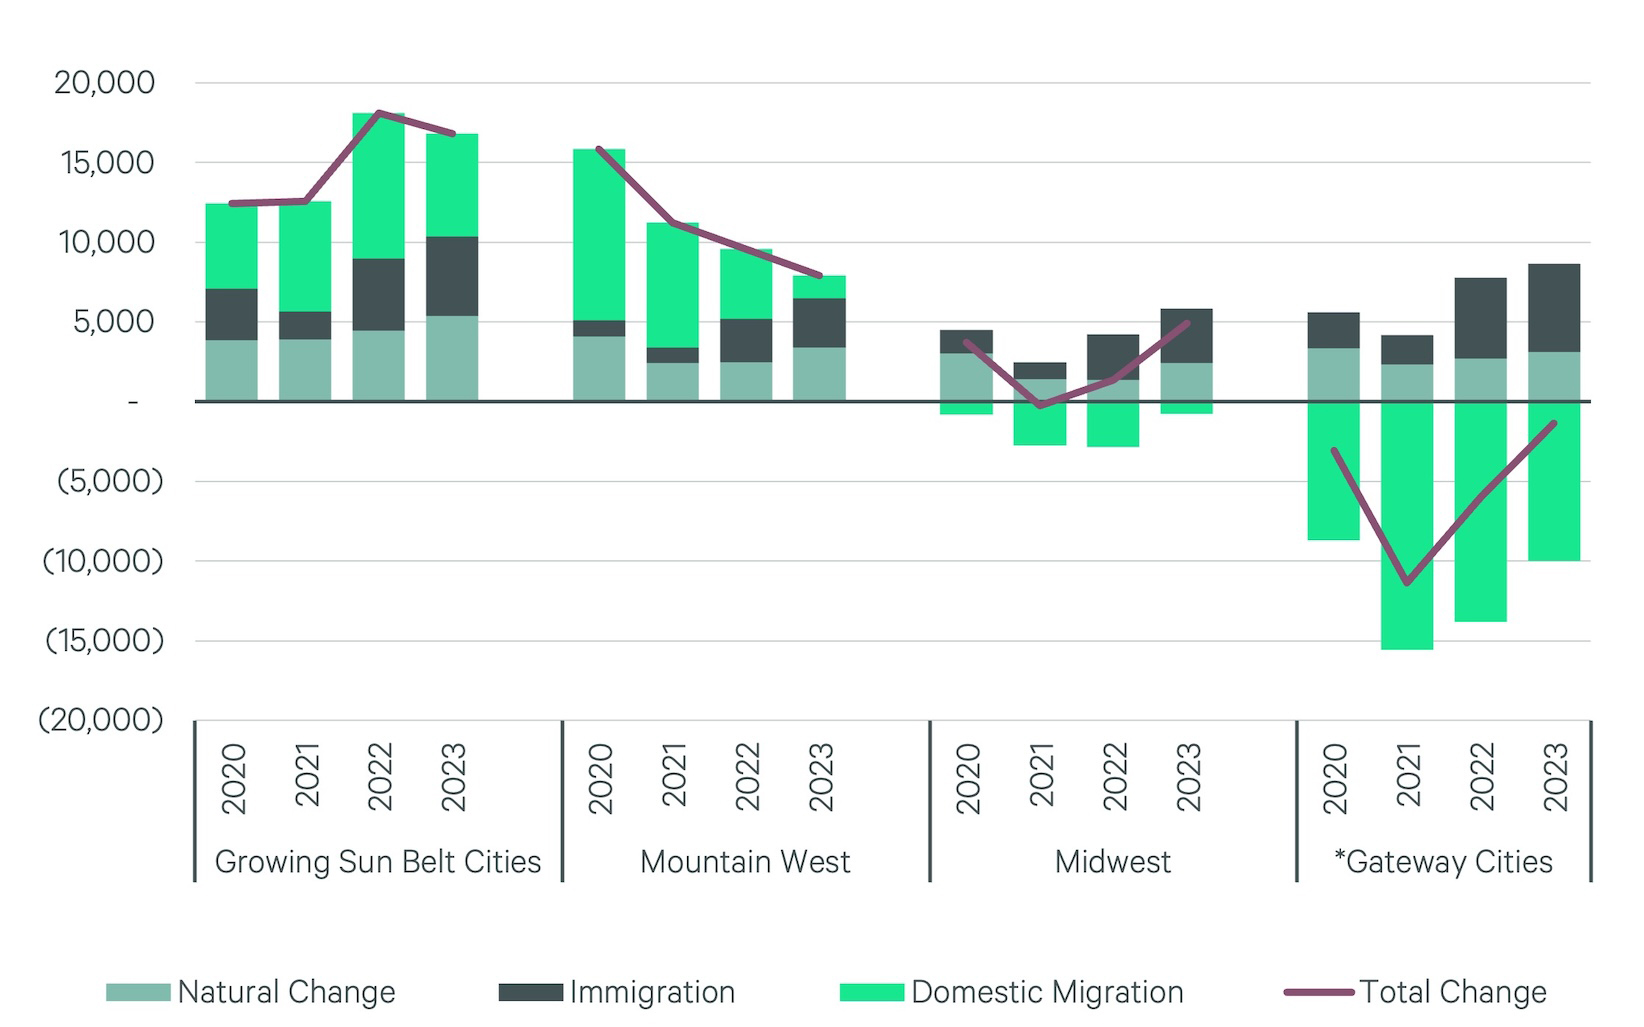
Note: Includes: New York, Los Angeles, San Francisco, Oakland, Boston, Chicago, Seattle, and Washington, D.C.
Let's Talk
Dennis Schoenmaker, Ph.D.
Global Head of Forecasting and Strategic Insight, Head of Data Centre of Excellence

