Intelligent Investment
Double-Digit Class B&C Office Cap Rates Are Commonplace
Chart of the Week
September 3, 2024 2 Minute Read

Receive EA Insights Directly in your Inbox
Earlier this year we reported that Class C office yields often exceed junk bond levels. Today double-digit cap rates have become pervasive for Class B and C properties.
Although office sales volume has been thin, CBRE’s Cap Rate Survey (CRS), offers fresh insight into how high yields have climbed for marginal buildings.
In the graphic below, each square represents a market, submarket type, risk profile and class – for example, Dallas, Suburban, stabilized, Class B office. The dark shaded squares represent cap rates that are estimated to be 10% or higher. As you can see, the percentage of such properties has grown exponentially over the past year and a half.
We can take some solace in the fact that the growth of above-10% cap rates has slowed to 18% in H1 2024 from 56% in H1 2023. Further, most CRS participants expect that office yields will remain flat or slightly decline in coming quarters. This corresponds with other evidence that office market fundamentals are beginning to stabilize.
Figure 1: Estimates for Office Yields by Market, Submarket Type, Risk Profile, Class
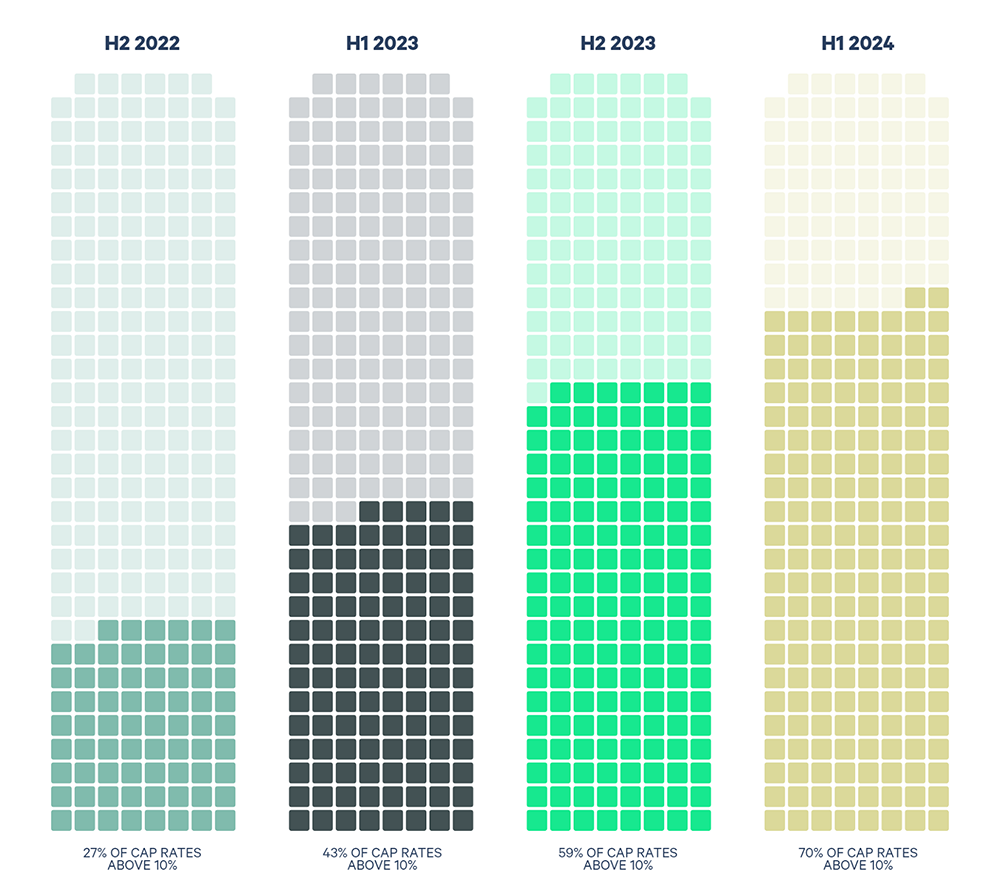
Source: CBRE Econometric Advisors.
Contacts
Dennis Schoenmaker, Ph.D.
Global Head of Forecasting and Strategic Insight, Head of Data Centre of Excellence


