Future Cities
East Coast and Midwest markets outperformed population growth expectations
Chart of the Week
March 7, 2023

Receive EA Insights Directly in your Inbox
In the years between its once-a-decade population count, the U.S. Census Bureau uses data on births, deaths and migration to estimate population change in metro areas. With the release of the 2020 Census data, we can compare actual versus expected population growth for the 2010-2020 period.
Figure 1 shows the top 10 metros with at least 2 million people where population growth was over- and under-estimated. The pre- 2020 Census estimates showed a red-hot Sun Belt juxtaposed with low-growth Midwest and East Coast metros. The 2020 Census largely confirmed these trends, but with caveats. While Sun Belt growth was high, the trajectory was not as steep as anticipated. Conversely, large East Coast and Midwest metros significantly outperformed expectations, and growth there was not as weak as feared. Orlando and Nashville are notable outliers – Sun Belt markets where growth exceeded expectations.
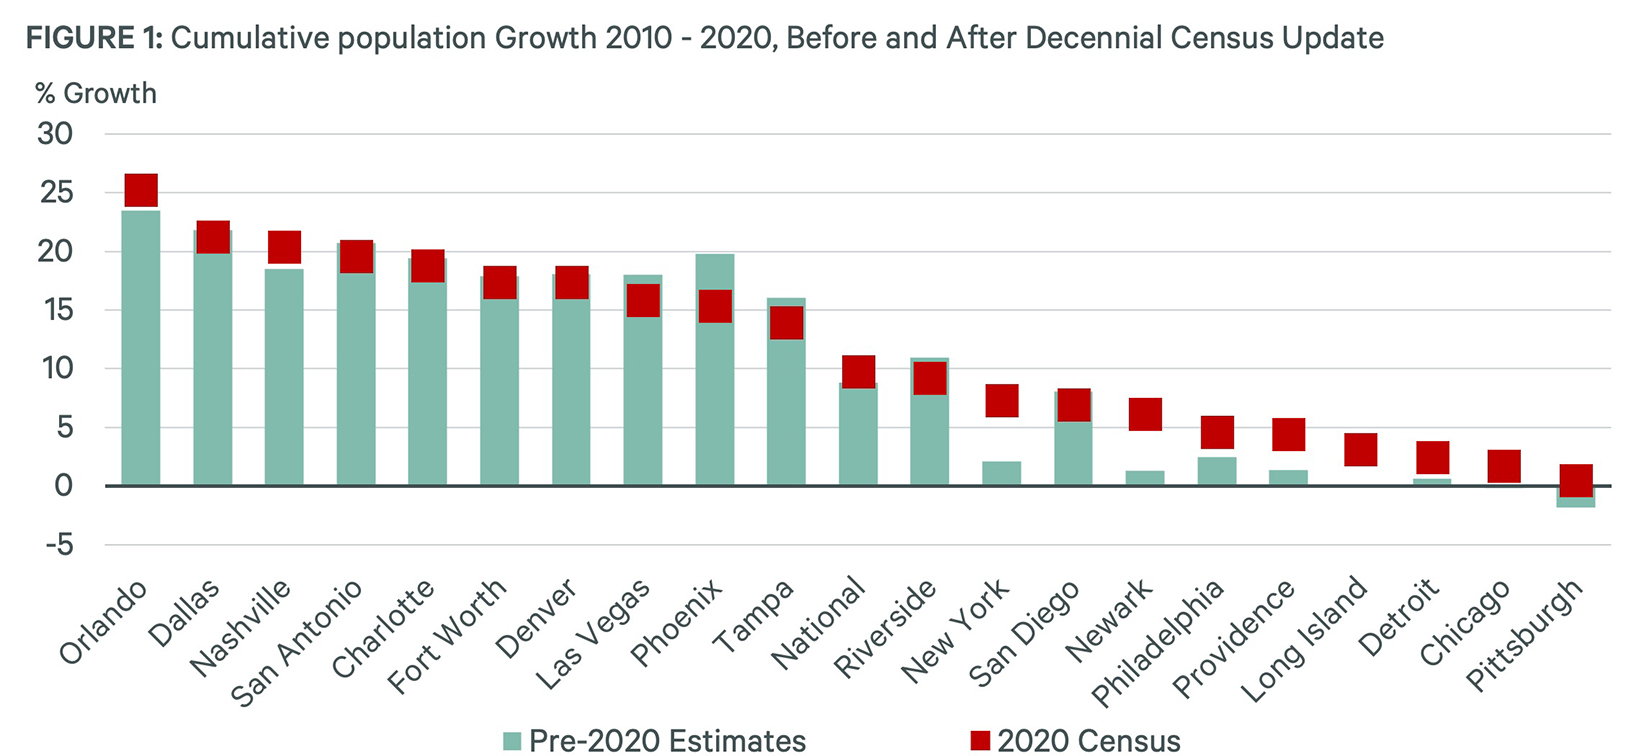
CBRE EA, Oxford Economics.
Figure 1 shows the top 10 metros with at least 2 million people where population growth was over- and under-estimated. The pre- 2020 Census estimates showed a red-hot Sun Belt juxtaposed with low-growth Midwest and East Coast metros. The 2020 Census largely confirmed these trends, but with caveats. While Sun Belt growth was high, the trajectory was not as steep as anticipated. Conversely, large East Coast and Midwest metros significantly outperformed expectations, and growth there was not as weak as feared. Orlando and Nashville are notable outliers – Sun Belt markets where growth exceeded expectations.
CBRE EA, Oxford Economics.
Let's Talk
Dennis Schoenmaker, Ph.D.
Global Head of Forecasting and Strategic Insight, Head of Data Centre of Excellence

