Intelligent Investment
More Signs of Thawing in the Office Capital Markets
Chart of the Week
September 10, 2025 2 Minute Read

Receive EA Insights Directly in your Inbox
The headlines about the office sector are no longer uniformly negative. Positive net absorption has returned in most markets, and more tenants want to expand their office footprint, which points to stronger Net Operating Income (NOI) prospects. Although office fundamentals have been on the mend for several quarters, the office capital markets have languished, but this, too, may be shifting — even for lower-tier properties.
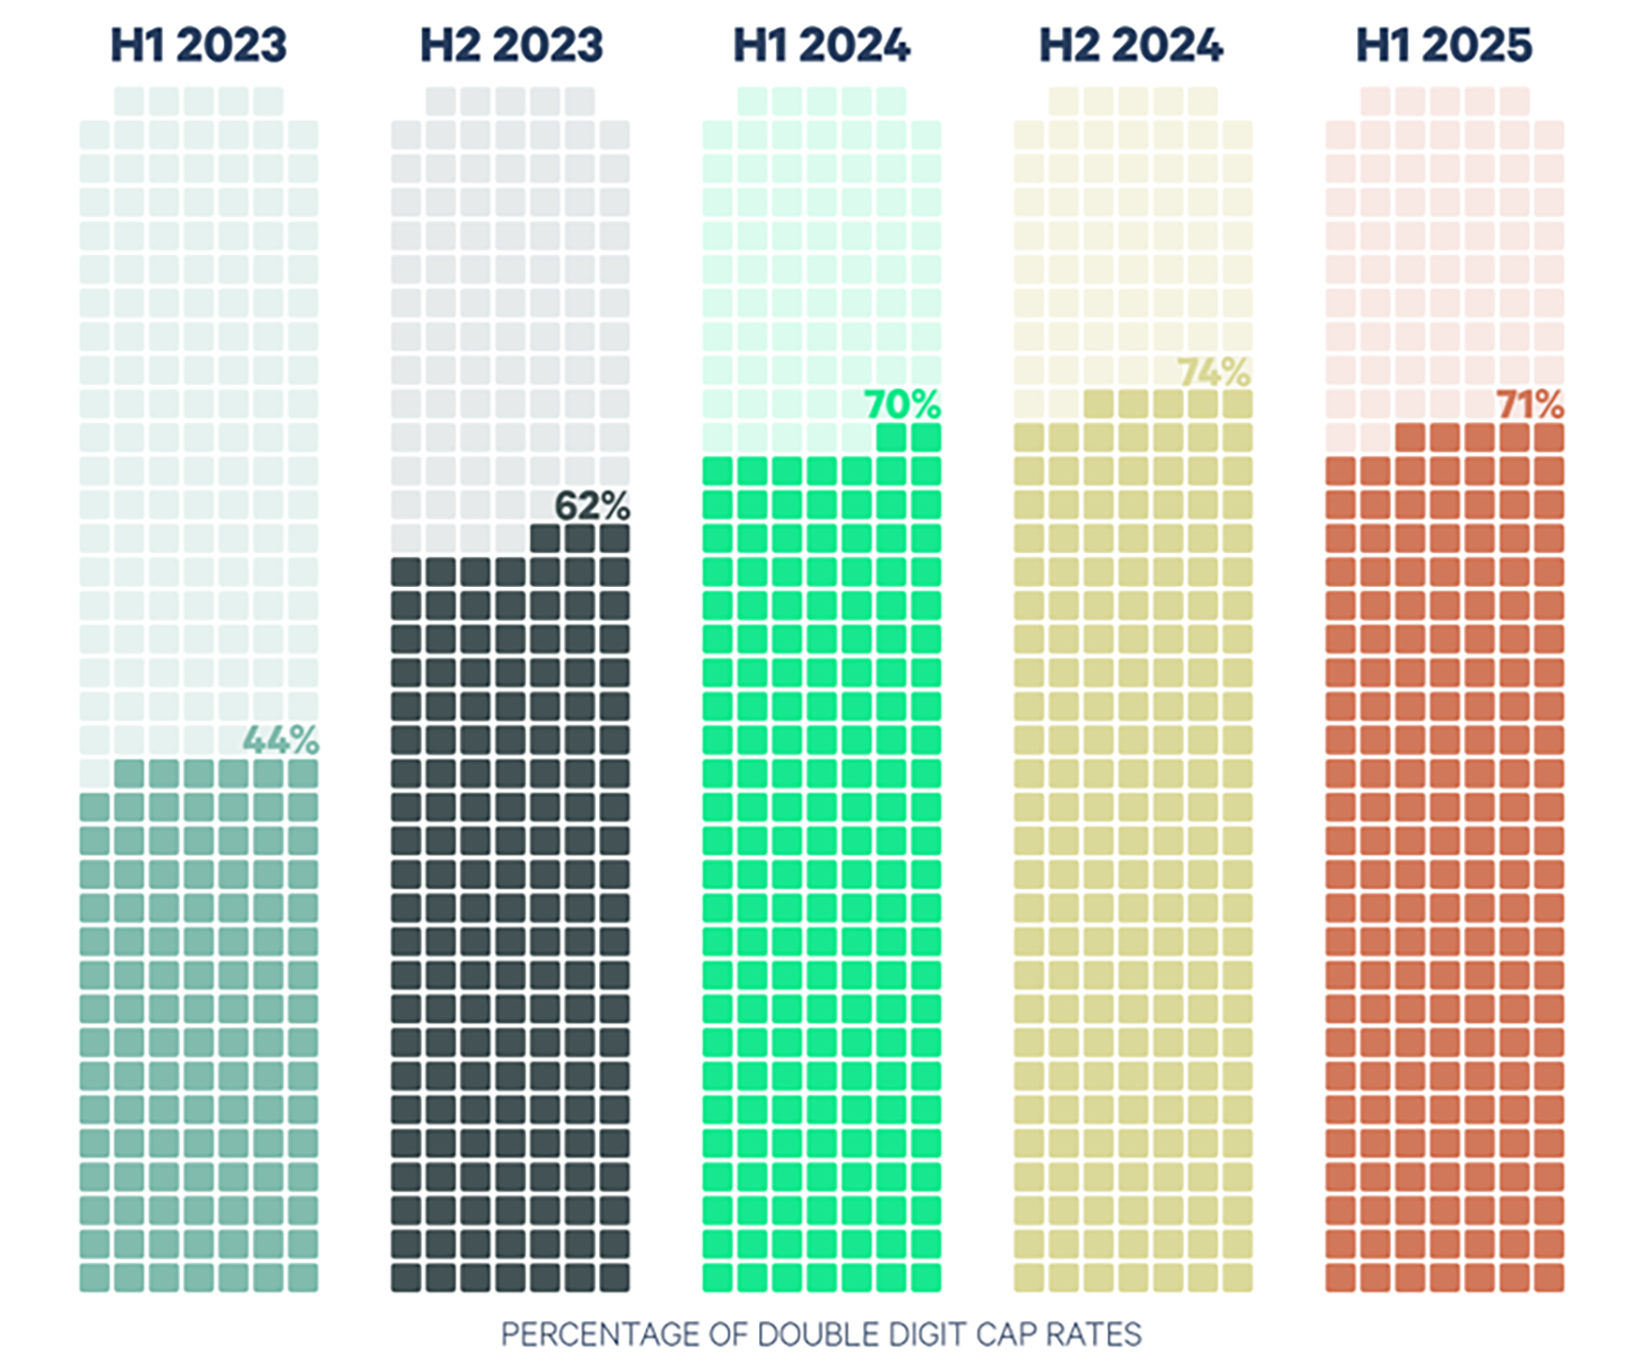
CBRE’s Cap Rate Survey (CRS) asks industry participants to estimate office yields by market, submarket type, risk profile and property class. Figure 1 presents cap rate estimates for Class B and C office properties across 36 markets over the past five surveys. For example, a single square could represent Dallas suburban, stabilized, Class B offices. The dark-shaded squares represent cap rate estimates that are 10% or higher.
After rising for the past four surveys, the H1 2025 CRS saw a decline in the percentage of properties with double-digit cap rate estimates. While over 70% of B and C properties are still plagued by double-digit cap rates, the modest decrease in 2025’s first half may signal the start of a recovery phase.
Figure 1: Estimates for Office Yields by Market, Submarket Type, Risk Profile, and Class