Intelligent Investment
There is Nuance to the Office Story
Chart of the Week
March 18, 2024 2 Minute Read

Receive EA Insights Directly in your Inbox
The sobering headlines about the office sector are largely accurate: vacancy rates are at historic highs and sales comps, while few, reveal a stark loss in value. What’s often lost amid the doom-and-gloom, however, are the stark differences between office asset classes.
Prime office buildings almost always have lower vacancy than their Class A counterparts. But today the spread has widened as tenants are increasingly eschewing commodity buildings in favor of best-in-class office space.
Asking rents, however, mask the dichotomy in building performance. Both Prime and Class A asking rents today are above 2018 levels. This makes sense because landlords are often loathed to drop asking rents and prefer to offer more generous incentive packages to attract tenants.
A more nuanced measure of rent values – what we call economic rent – provides a more revealing picture. Prime economic rent, which is computed by multiplying asking rent by market occupancy, stands 14% above 2018 levels and near the 2020 peak. In contrast, economic rent for Class A buildings, which have borne the brunt of the occupancy losses, are down 10% since the pandemic radically changed office cultures and companies began trading up to higher quality space.
Figure 1: Asking and Economic Rent Indices (Q1 2018 = 100)
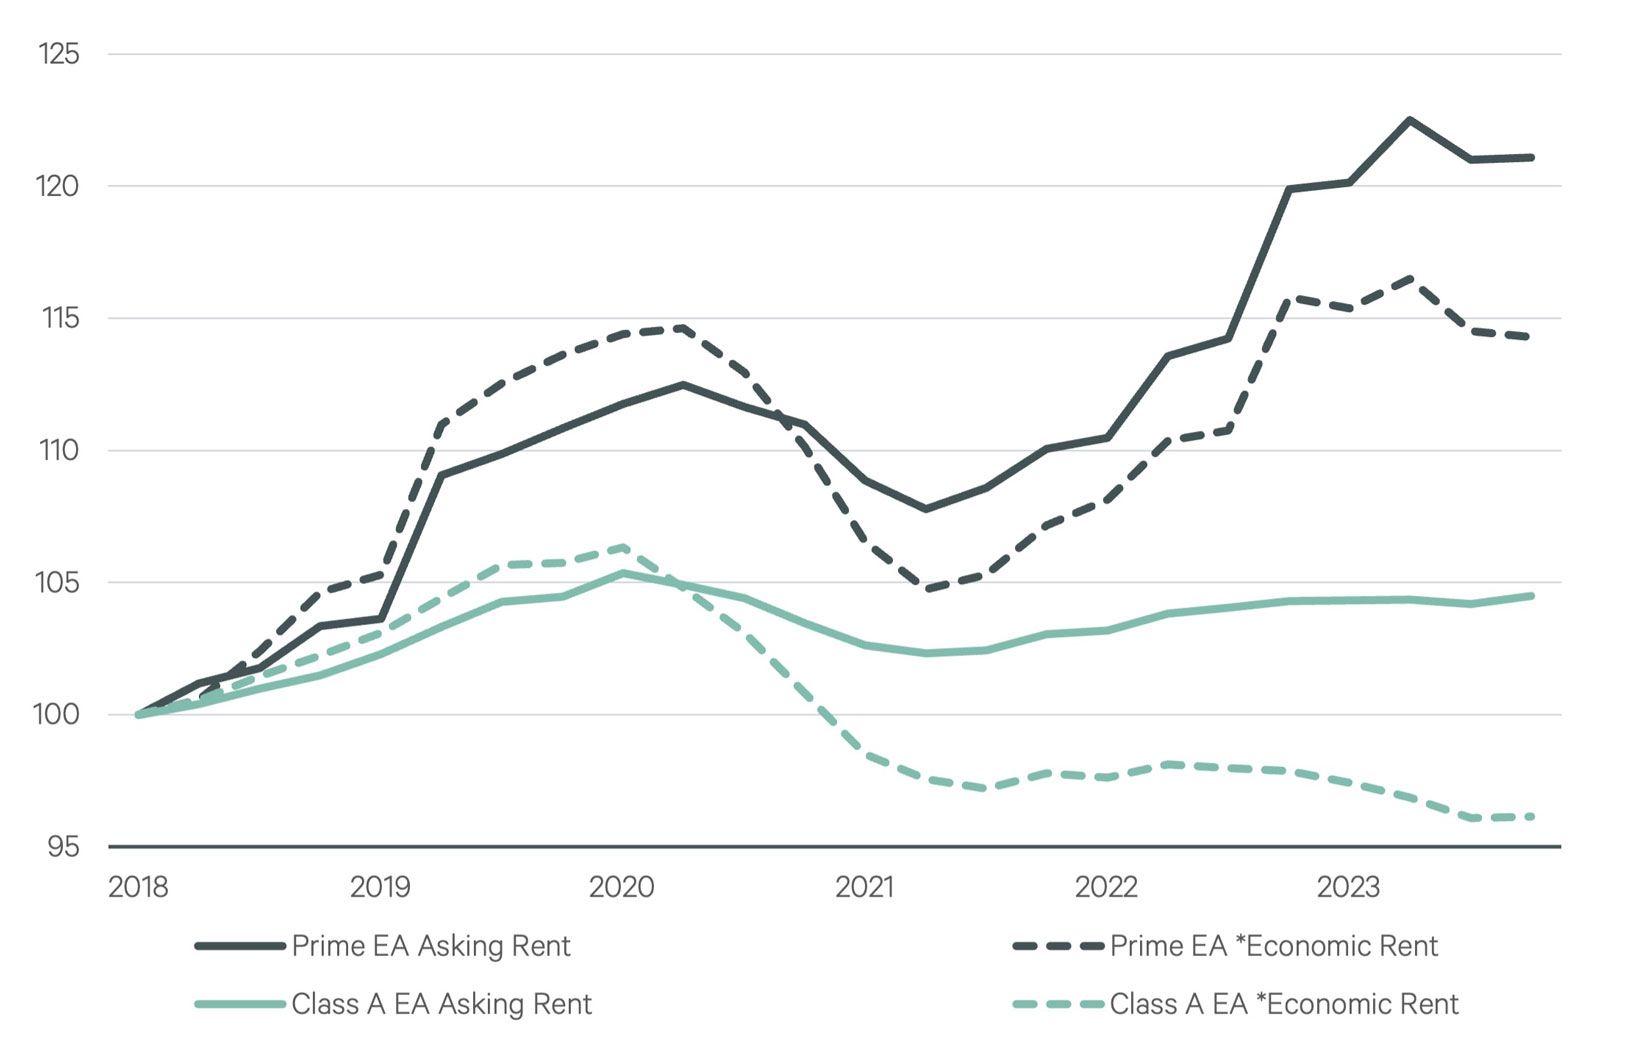
*Economic Rent is asking rent multiplied by occupancy.
Let's Talk
Dennis Schoenmaker, Ph.D.
Global Head of Forecasting and Strategic Insight, Head of Data Centre of Excellence


