Intelligent Investment
Continued Prime Space Recovery Augurs Well for the Rest of the Office Market
EA Chart of the Month: Stefan Weiss and Michael Leahy
June 25, 2026 2 Minute Read

Receive EA Insights Directly in your Inbox
U.S. office vacancy remains elevated at around 19% nationally. However, prime office vacancy, currently at 12.7%, has been falling rapidly with the 80 basis point (bp) decline in each of the past two quarters, the largest since 2018. The 640-bp spread between prime and non-prime is now the largest on record.
Newer buildings have consistently shown positive net absorption since the depths of the pandemic and the trend will only continue as strong top-of-the-market demand is met with virtually no new supply.
Negative net absorption in recent years has been primarily attributed to ‘70s and ‘80s vintage buildings. Notably, all age tranches except the ‘70s and ’80s saw positive net absorption in Q1 2026, extending a trend that became evident last year.
We believe the prime space recovery will cascade into the broader office market as the supply of the best space is depleted. The prime segment offers important signals about the recovery of the broader office market. For example, Manhattan prime vacancy peaked at year-end 2022, a full year before the overall Manhattan vacancy peaked. National prime vacancy began to decline in late 2024, and like clockwork, national overall vacancy is now beginning to improve. Most major U.S. markets are on the same recovery curve, just in different stages.
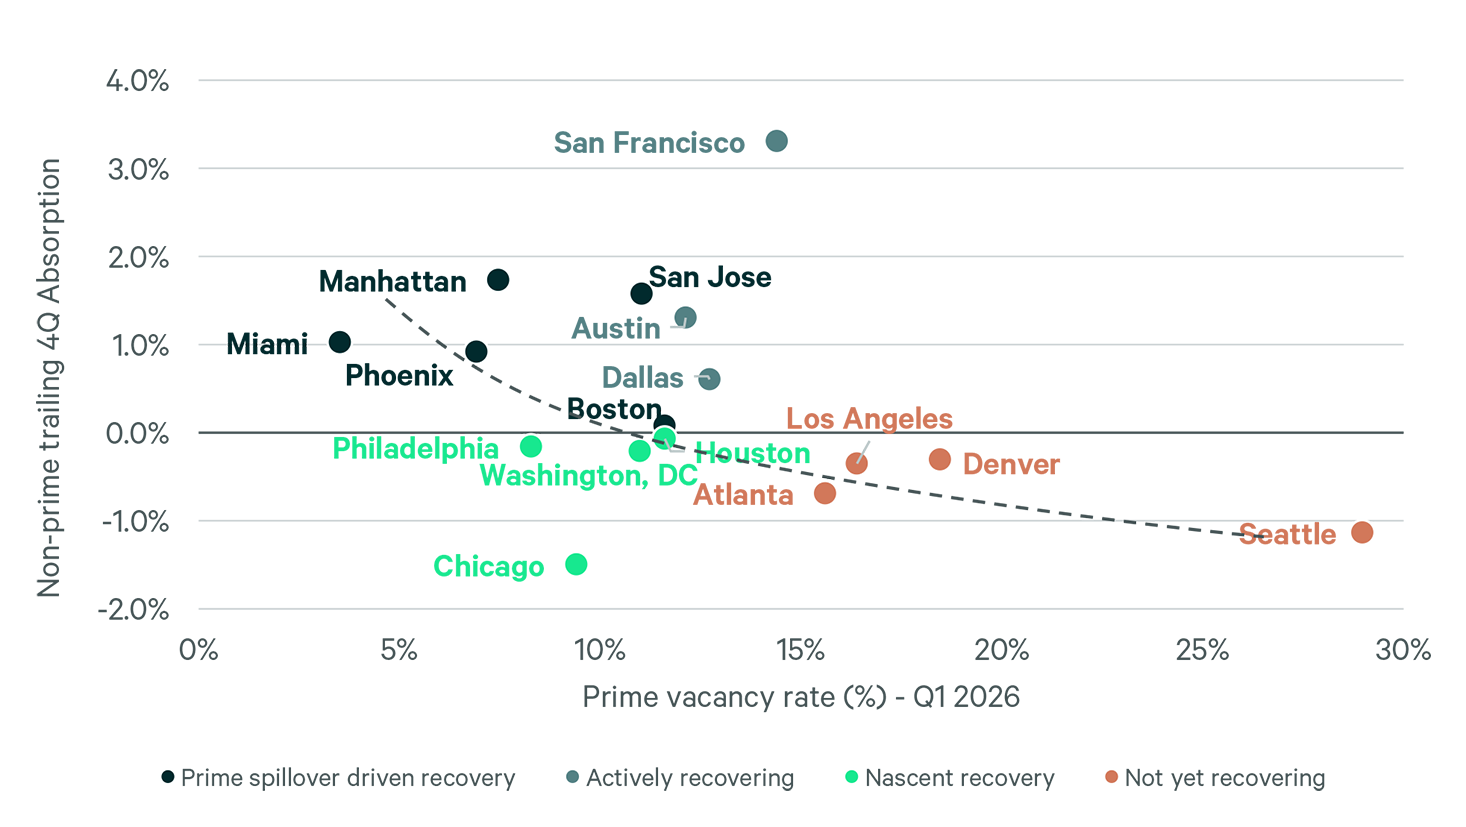
Figure 1 plots each major U.S. office market by prime vacancy (x-axis, Q1 2026) against non-prime trailing four-quarter absorption as a share of stock (y-axis). It shows that demand begins to spill into non-prime space when prime vacancy reaches about 10 to 12%. Of course, not every market fits neatly along the recovery line. San Francisco, with a prime vacancy rate of 14.4%, has the highest non-prime absorption rate at over 3%. This is due, in part, to AI-related companies aggressively leasing non-prime space.
Figure 1: Prime Vacancy vs. Non-Prime 4-Quarters Trailing Absorption (%)