Intelligent Investment
Expansions by Large Occupiers Dominate Top 100 Office Leases of 2025
January 23, 2026 4 Minute Read

Expansions by large occupiers accounted for 55% of the 28.1 million sq. ft. total of 2025’s top 100 office leases. In 2024, expansions comprised less than half of the top 100 leases by square footage.
Relocations increased to 31% of top-occupier activity in 2025 from 21% in 2024. Nearly two-thirds of these relocations were expansions. Occupiers also appear to be trading up, as 25% of relocation activity went to prime buildings, which comprise just 8% of total office inventory. These trends show a renewed commitment by large occupiers to both expand and upgrade their office space.
Figure 1: 2025 Top 100 Leases by Type
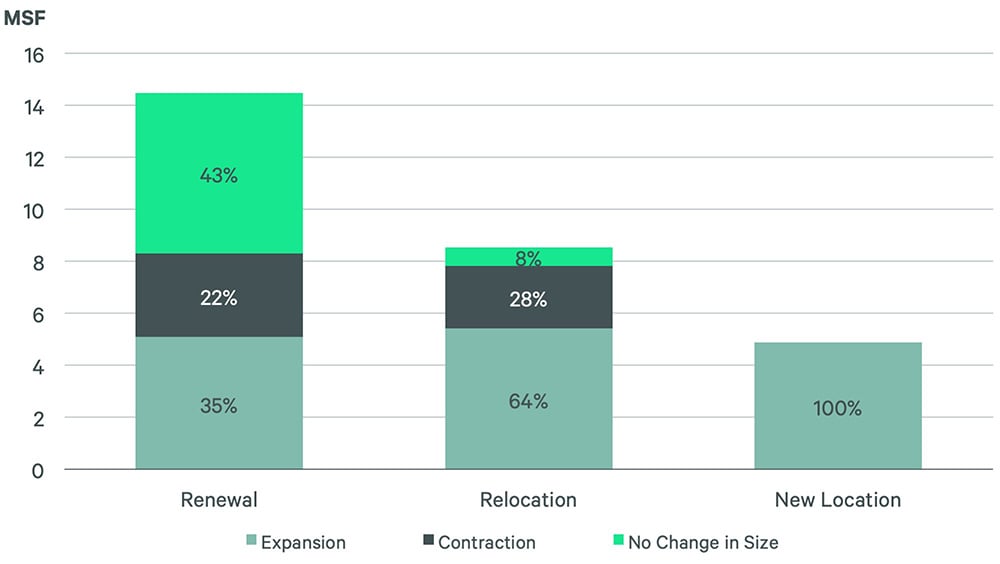
Source: CBRE Research, Q4 2025.
Manhattan had the biggest share of the top 100, accounting for 36% of their total square footage. Silicon Valley and Washington, D.C. had the next highest shares of 8% each. Cuts to the federal government resulted in a drop in Washington, D.C.’s share of the top 100, although private-sector occupiers in D.C. doubled their share from 2024. Manhattan and Silicon Valley were the only two markets with an increased share of the top 100, both up by 3 percentage points.
Figure 2: Metro Share of 2025 Top 100 Leases by Square Footage
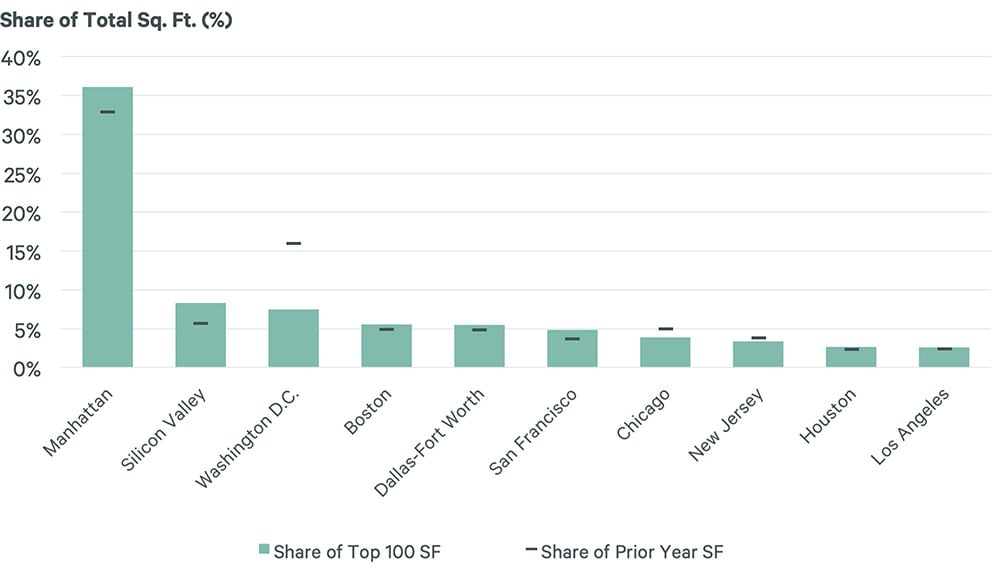
Source: CBRE Research, Q4 2025.
One clear reason for the improved performance of Manhattan and Silicon Valley is the industry mix of the top 100. Finance & Insurance—a top employer in Manhattan—comprised 29% of the top 100’s total square footage, up from 17% in 2024. The Technology sector, which dominates the Silicon Valley, followed closely with a 28% share, down from 32% in 2024. No other industry had more than a 10% share. Nearly two-thirds of the leasing activity by both the Finance & Insurance and Technology sectors was in expansions, signaling that some of their largest occupiers are in growth mode.
Figure 3: 2025 Top 100 Leases by Industry (sq. ft.)
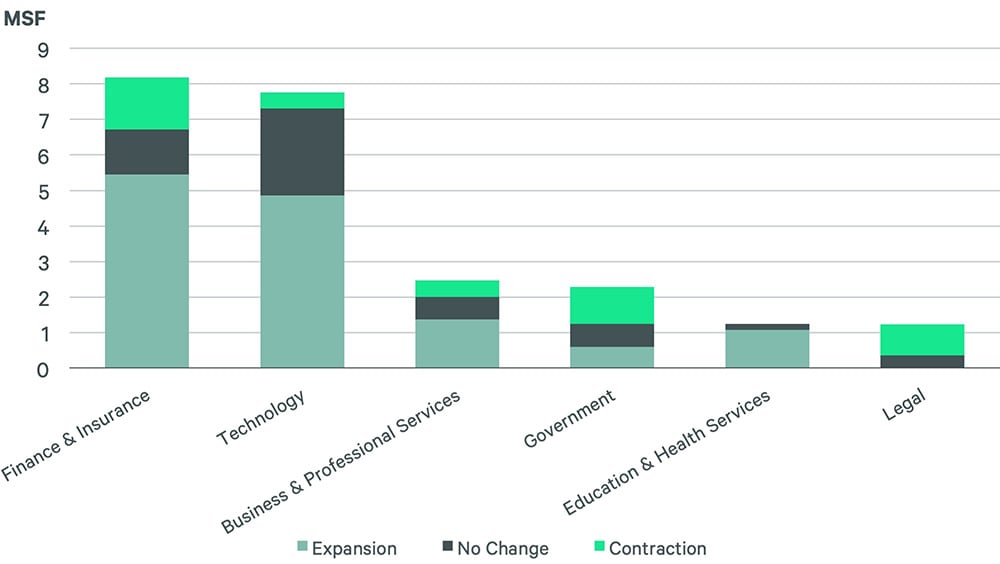
Source: CBRE Research, Q4 2025.
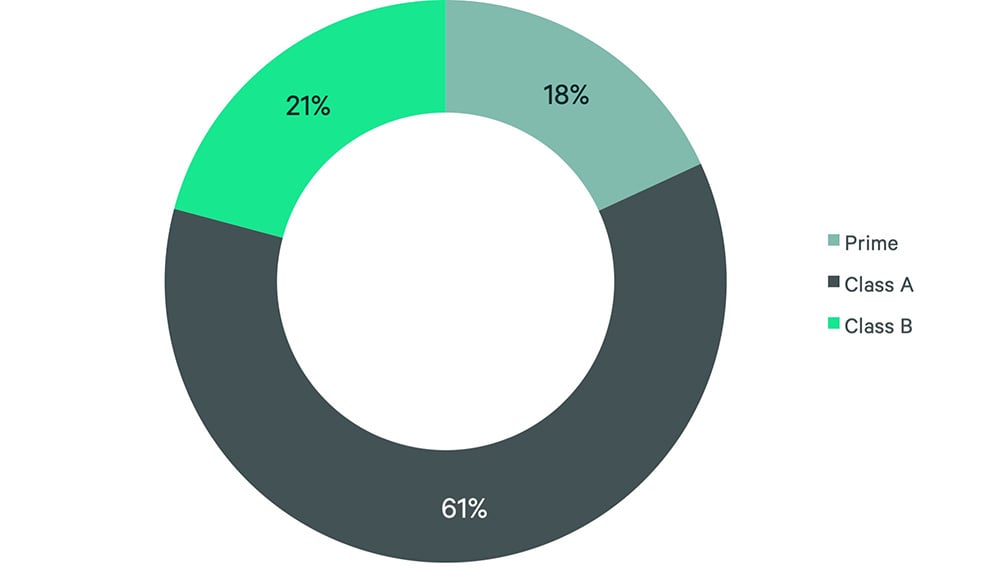
Downtown buildings accounted for 59% of the top 100 office leases, signaling that large users prefer urban hubs that provide better connectivity and collaboration. Prime office buildings captured 18% of the top 100 deals, despite comprising just 8% of overall supply by square footage. The next tier of Class A buildings captured 61% of large occupier demand in 2025 (52% of overall supply) and Class B assets captured 21% of this activity (40% of overall supply).
Figure 4: 2025 Top 100 Office Leases by Building Class (sq. ft.)
Large block activity is expected to continue clustering in the core districts of gateway markets, driven by the Finance & Insurance and Technology sectors. However, a lack of available high-quality space could delay commitments, driving a higher share of renewals among the largest leases of 2026.
Related Insights
-

Despite uncertainty, growth will continue for the U.S. commercial real estate market in 2026.
-
Viewpoint | Adaptive Spaces
Prime Office Buildings Benefit from New Working Patterns & Tenant Preferences
June 19, 2024

Explore what the widening performance gap between prime and non-prime U.S office buildings means for investors.

Office
Realize potential in every dimension by leveraging the global leader in Office Services.


