Future Cities
Hexagons in Action: A More Revealing View of the Phoenix Logistics Market
Map of the Month
July 30, 2024 2 Minute Read

Receive EA Insights Directly in your Inbox
What lessons could we learn by looking at industrial submarkets through the lens of hexagons rather than the standard submarket boundaries?
The utility of hexagons can be measured in two ways:
- Do they uncover granular data that is not too volatile?
- Do they reveal market themes that may not be readily apparent from submarket data, but we know intuitively to be true?
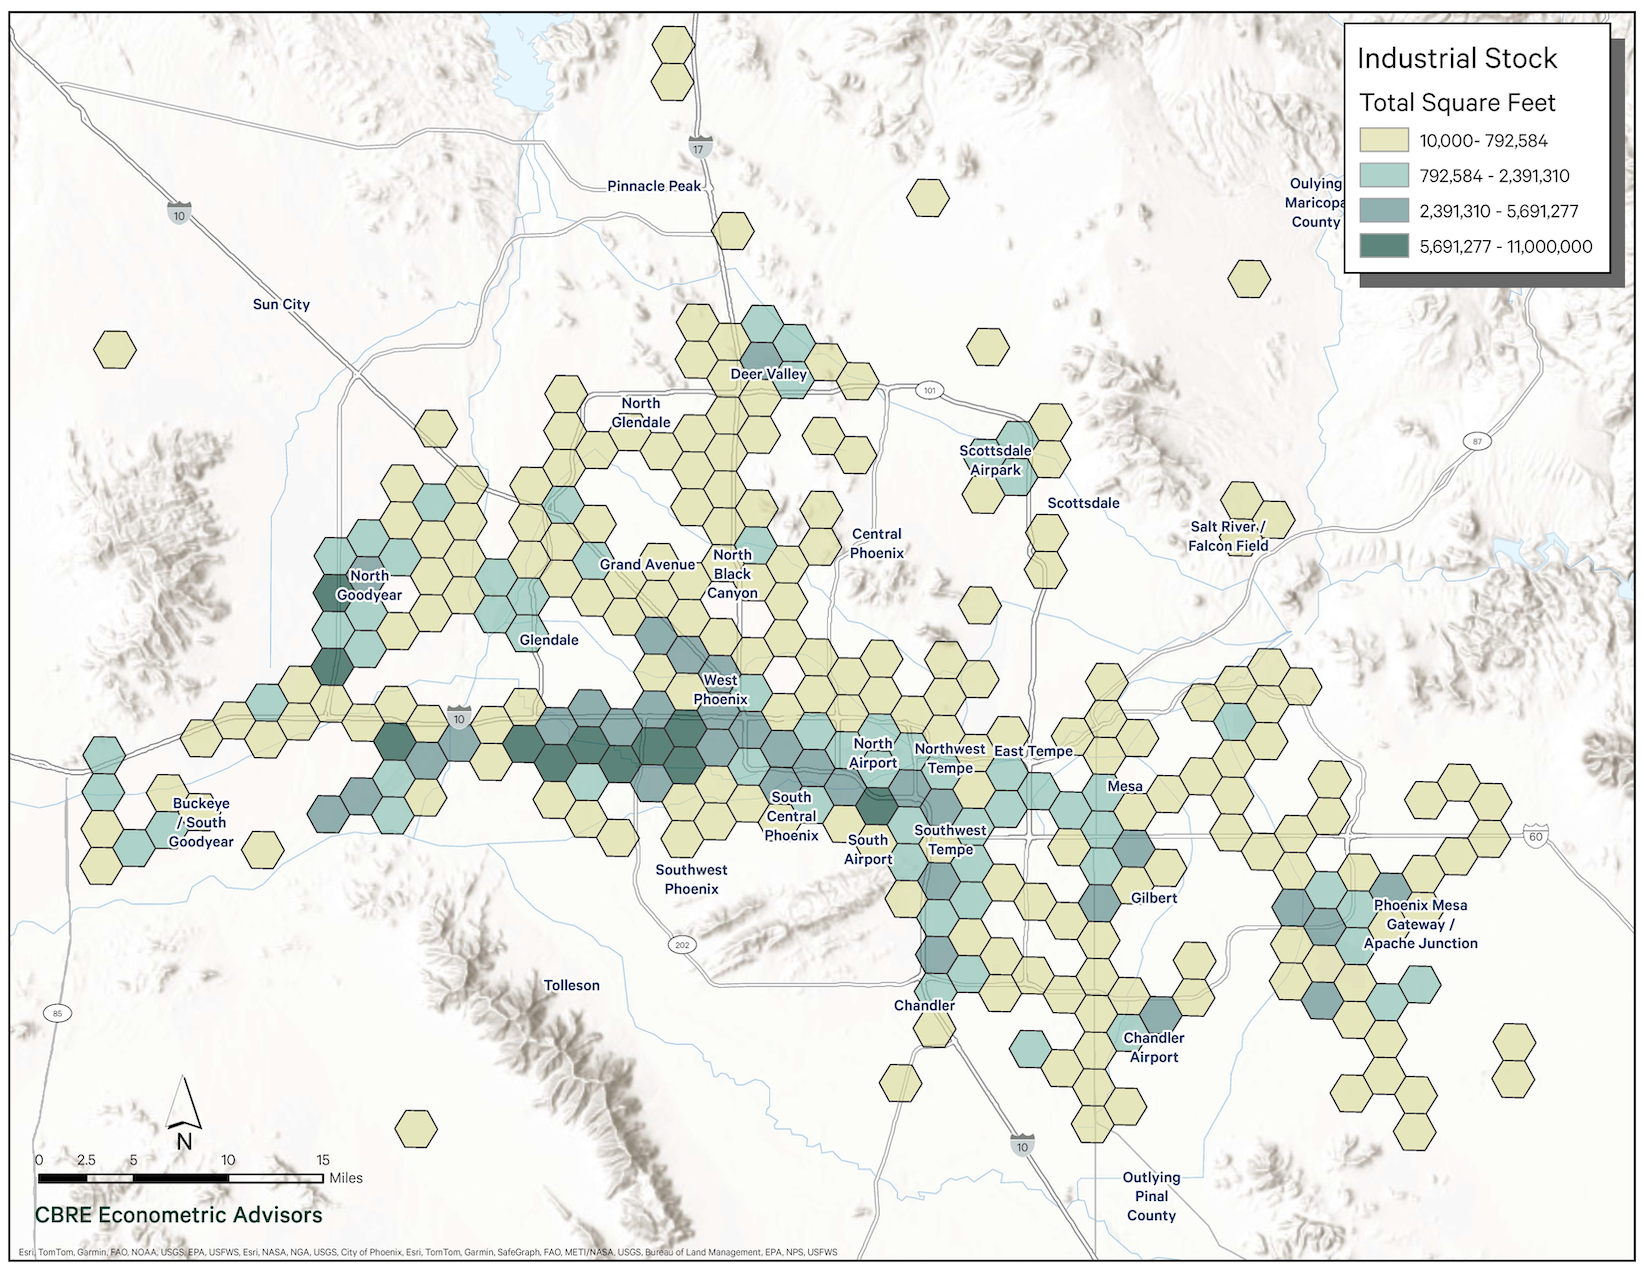
The map below is one of a series that employ hexagons’ help to explain the Phoenix industrial market. It was produced using Uber’s open-sourced H3 mapping technology.
The hexagons, which allow us to analyze on a much more granular scale than traditional submarket boundaries, pass the first litmus test (avoiding excessive data volatility) by neatly dividing the market into rational components based on market inventory.
Regarding the second litmus test (revealing key market themes), the map shows a) clustering of properties around I-10 and I-17 – confirming the importance of highway access – and b) a weighting of inventory toward metro Phoenix’s western half.
FIGURE 1: Phoenix Industrial Stock by Uber H3 Hexagon
Contacts
Dennis Schoenmaker, Ph.D.
Global Head of Forecasting and Strategic Insight, Head of Data Centre of Excellence


