Future Cities
Reimagining Atlanta Logistics
Map of the Month
November 25, 2024 2 Minute Read

Receive EA Insights Directly in your Inbox
Our June 2023 map color-coded the Atlanta logistics market by highway proximity: dark blue areas contain a highway ramp; light blue areas are adjacent to a highway ramp; and cream areas are not highway-ramp adjacent.
The data showed that 55% of logistics inventory is within areas that house highway ramps and another 31% is in highway-adjacent areas.
However, this analysis has limitations. The map’s scaling, with larger blocks in less populated areas, combined with color coding, can create a visual bias that suggests that a significant portion of the logistics inventory is in rural communities.
We can overcome this visual limitation by re-doing the analysis using uniform two-square-mile Uber hexagon mapping (resolution 7). Under our new approach, the “contains” (41%) and “adjacent” (41%) areas still house more than 80% of the total inventory. But logistics inventory in the “non-highway-adjacent” areas increases by almost five percentage points to 36%. This provides a clearer picture of how logistics inventory is distributed across the Atlanta market.
The hexagon-based map is not only more visually appealing, but more accurate as well.
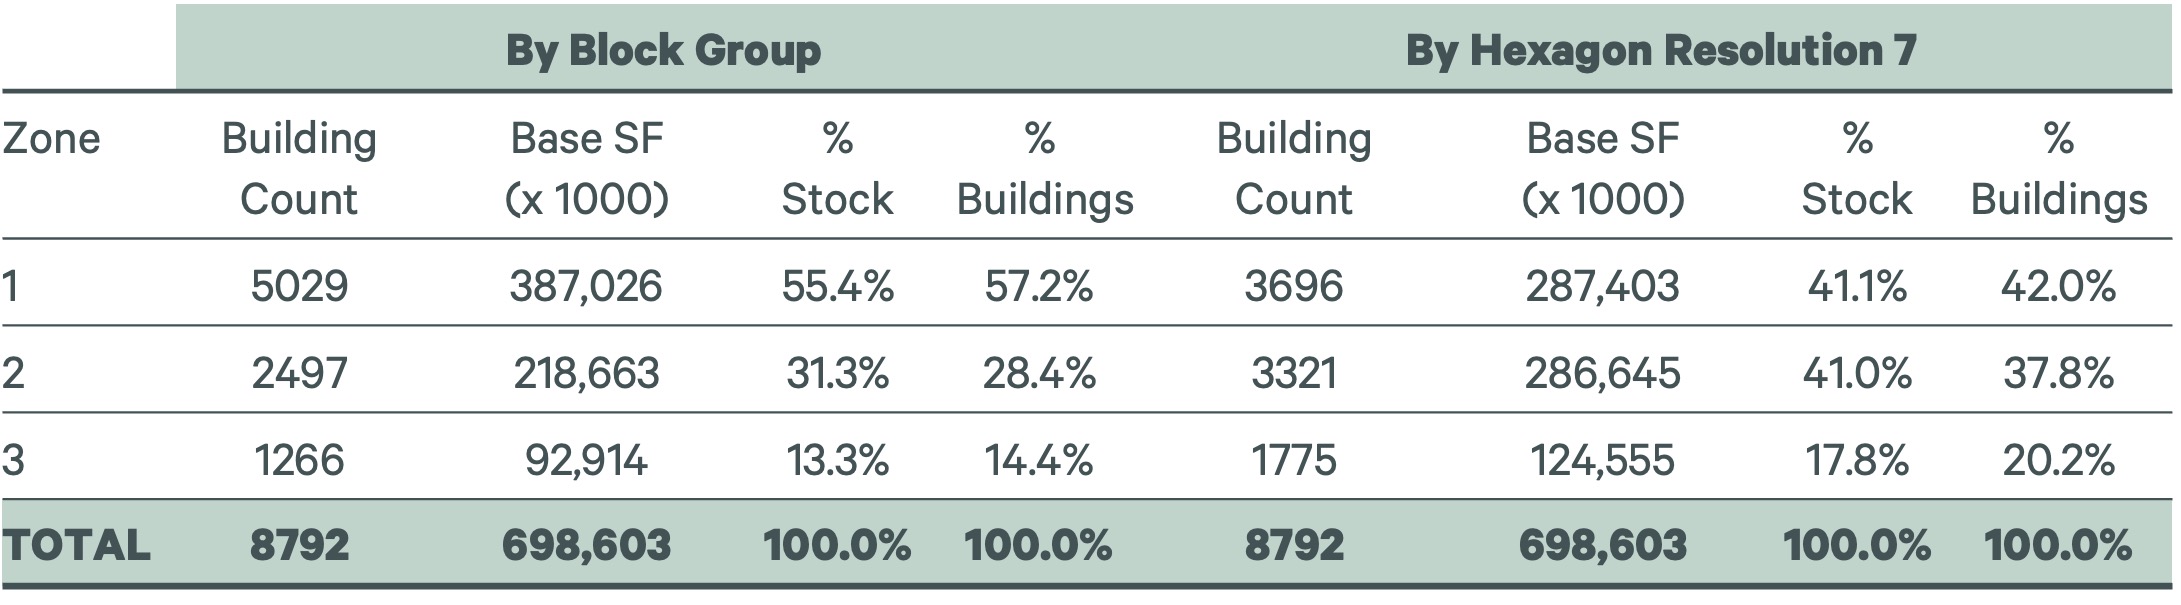
Figure 1: Highway Ramp Proximity in US Census Block Groups vs Uber H3 Hexagons

Contacts
Dennis Schoenmaker, Ph.D.
Global Head of Forecasting and Strategic Insight, Head of Data Centre of Excellence


