Intelligent Investment
February 2023
CBRE Pulse of U.S. Office Demand
March 23, 2023 5 Minute Read
Looking for a PDF of this content?
- Los Angeles and Philadelphia had the greatest degree of office market recovery in February based on a composite index of leasing activity, tenants in the market and sublease space availability.
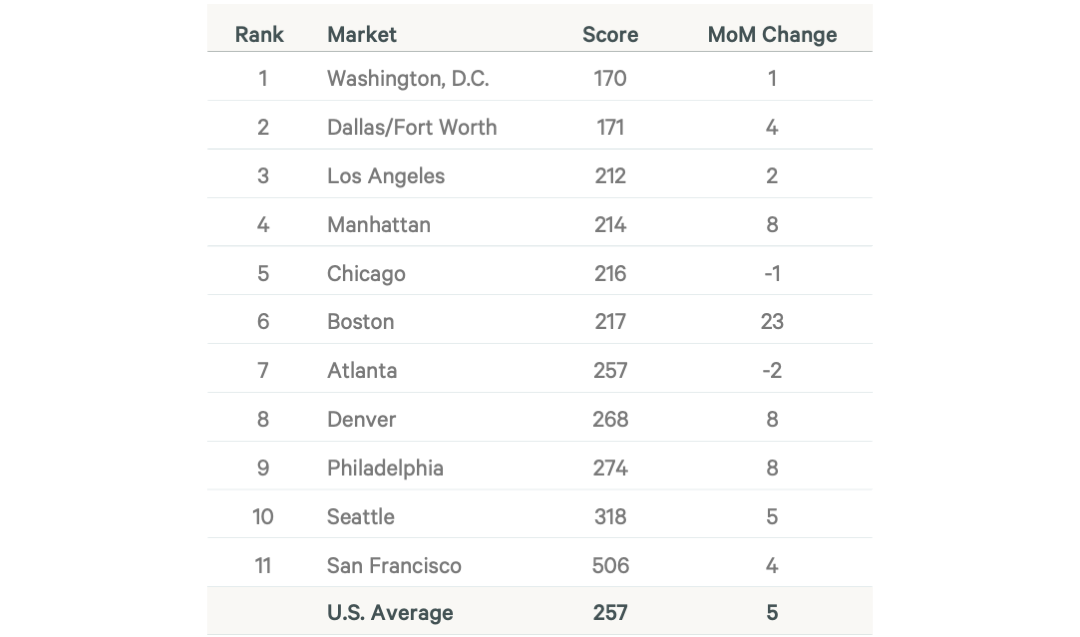
- Amid rising economic headwinds, the Leasing Activity Index fell in 10 of the top 11 U.S. markets tracked by CBRE, with Seattle, (-24 points), Denver (-17) and Dallas/Fort Worth (-17) down the most. Washington, D.C. (+2) was the only market with increased leasing activity in February, following a 37-point decline in January.
- The overall Tenants in the Market (TIM) Index rose by 4 points in February, the first monthly increase since May 2022. Manhattan (+6 points) remained the TIM leader. Dallas/Fort Worth (+15) had the largest increase in February, followed by Seattle (+10).
- The overall Sublease Availability Index increased by 5 points in February, largely driven by a 23-point increase in Boston, where several tech companies and one medical device company gave back large blocks of space. All other markets saw more modest increases, except for Atlanta (-2 points) and Chicago (-1).
What is the CBRE Pulse Report?
To gauge the pace of recovery, CBRE has created three indices for 11 major U.S. office markets—Atlanta, Boston, Chicago, Dallas/Fort Worth, Denver, Los Angeles, Manhattan, Philadelphia, San Francisco, Seattle and Washington, D.C.
Using CBRE data, these indices measure office market activity each month and provide early indications of when and where momentum in office demand may be shifting.
These metrics—space requirements of active tenants in the market (TIM), leasing activity and sublease availability—provide a clear picture of office demand since the COVID-19 pandemic began.
Note: Houston has been removed from the Pulse report and all historical data points have been restated.
Figure 1: Indexed Average Performance of Sublease Availability, TIM & Leasing Activity for Top 11 U.S. Markets
Source: CBRE Research, February 2023.
February 2023 Office Recovery Progress by Market
Figure 2: February 2023 Office Market Recovery Index, Top 11 U.S. Markets
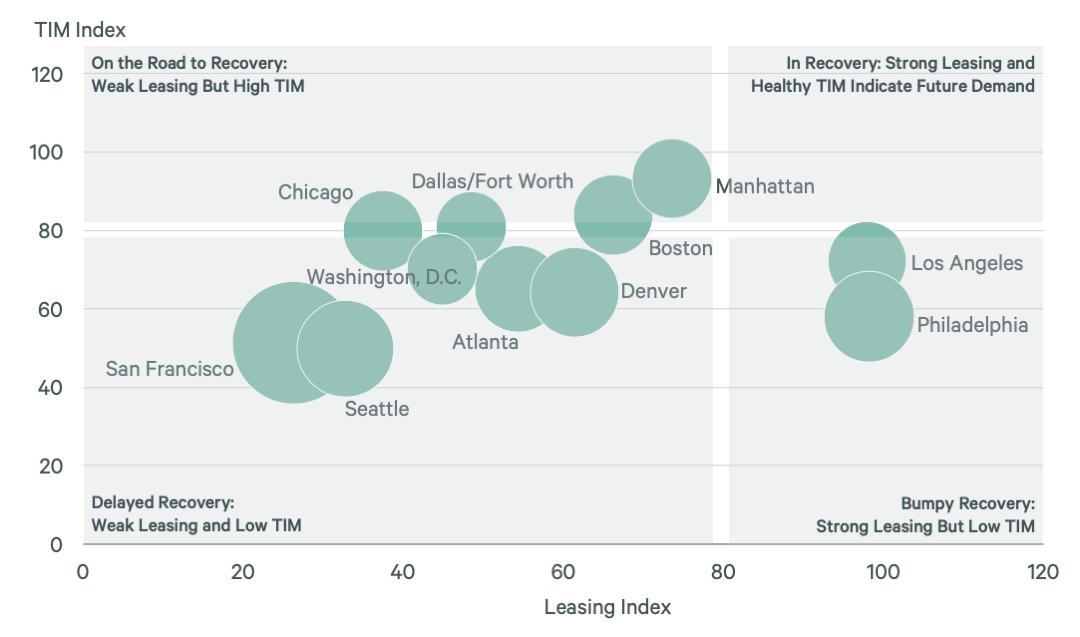
Note: Sublease Availability Index level is denoted by size of bubble (the bigger the bubble, the greater the availability).
Source: CBRE Research, February 2023.
Leasing Activity Index
Figure 3: Indexed Monthly Leasing Activity by Market Compared with 2018/2019 Average
Source: CBRE Research, February 2023.
Methodology Note: Leasing activity includes all new leases, expansions and renewals of 10,000 sq. ft. or more that close each month. The Leasing Activity Index uses a rolling three-month average of leasing activity. For most markets, this average is weighted 20% for the current month, 50% for the previous month and 30% for two months prior. For New York and Boston, where more accurate leasing data is available by the end of each month, the weights are 50% for the current month, 30% for the previous month and 20% for two months prior. The monthly rolling average is compared with a pre-pandemic baseline, which is the average monthly leasing activity between 2018 and 2019. The index level for the baseline is 100.
Figure 4: February 2023 Leasing Activity Index – Top 11 U.S. Markets

Source: CBRE Research, February 2023.
Tenants in the Market Index
Figure 5: Indexed Monthly Square Footage of Tenant Requirements by Market Compared with 2018/2019 Average
Source: CBRE Research, February 2023.
TIM Index methodology note: CBRE tracks the total square footage of requirements from active tenants in the market, with minimum requirements of 10,000 sq. ft. The TIM Index compares the total monthly TIM requirements to a pre-pandemic baseline, which is the average of TIM requirements recorded by CBRE in 2018 and 2019. The index level for the baseline is 100. In most cases, when tenant requirements are given as a range, the index uses the minimum square footage., However, Seattle records TIM using the average requirement within the tenants' size range, while Philadelphia uses the maximum square footage.
Figure 6: February 2023 TIM Index–Top 11 U.S. Markets
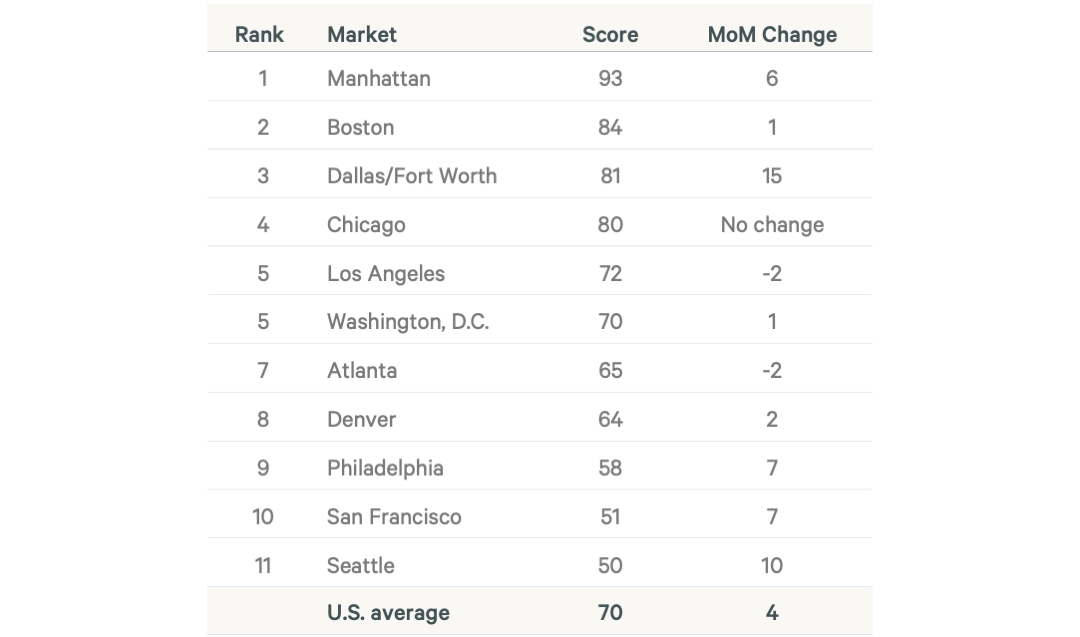
Source: CBRE Research, February 2023.
Sublease Availability Index
Figure 7: Indexed Monthly Sublease Availability by Market Compared with 2018/2019 Average
Source: CBRE Research, February 2023.
Methodology Note: Sublease availability measures the total square footage of sublease space available for occupancy. The Sublease Availability Index compares monthly sublease availability totals with a pre-pandemic baseline, which is the average amount of sublease space available in 2018 and 2019. The index level for the baseline is 100. In contrast to the Leasing and TIM indices, a higher score on the Sublease Availability Index is considered undesirable as it reflects an increase in available sublease space.
Figure 8: February 2023 Sublease Availability Index–Top 11 U.S. Markets
Source: CBRE Research, February 2023.
Related Insights
Manhattan, Los Angeles and Philadelphia had the most progress in office market recovery in January based on a composite index of leasing activity, tenants in th...
Los Angeles and Philadelphia had the most progress in office market recovery in December based on a composite index of leasing activity, tenants in the market a...
Boston continued to set the pace for office recovery in November based on a composite index of leasing activity, tenants in the market and sublease space availa...
Tenants continued to postpone leasing decisions amid high inflation, rising interest rates and hybrid working arrangements.


Insights in Your Inbox
Stay up to date on relevant trends and the latest research.