Intelligent Investment
U.S. Office Demand Slowed in February
CBRE Pulse of U.S. Office Demand
March 23, 2022 5 Minute Read
Read the full report and data for all 12 markets
The CBRE Pulse of U.S. Office Demand slowed for a second consecutive month in February. Occupiers remained hesitant to make new commitments and leasing activity tapered. However, tenant requirements were unchanged for the month and have improved since the second half of 2021. This suggests the decline in leasing may be temporary, and that leasing may pick up as omicron caseloads continue to rapidly decline.
What is the CBRE Pulse Report?
To gauge the pace of recovery, CBRE has created three indices for the 12 largest U.S. office markets—Atlanta, Boston, Chicago, Dallas/Fort Worth, Denver, Houston, Los Angeles, Manhattan, Philadelphia, San Francisco, Seattle, and Washington, D.C.
Using CBRE data, these indices measure office market activity each month and provide early indications of when and where momentum in office demand may be shifting. These metrics—space requirements of active tenants in the market (TIM), leasing activity and sublease availability—provide a clear picture of office demand amid the COVID-19 pandemic.
February Findings
The U.S. Leasing Index fell by 18 points month-over-month in February to a level of 76—the biggest monthly decline since CBRE began tracking the Pulse report data in March 2020. Occupiers exercised caution and delayed long-term leasing decisions. As a result, the Leasing Index levels of 10 of the 12 markets tracked by CBRE fell in February. The biggest declines occurred in Seattle (-50 points), Atlanta (-39 points) and Denver (-21 points). Nevertheless, Denver and Seattle remained among the top six markets for leasing activity. Dallas/Fort Worth and San Francisco were the only markets without declines in their leasing index levels, unchanged at 93 and 40, respectively.
The U.S. Tenants in the Market (TIM) Index was unchanged at 89 in February, signaling that the downturn in leasing activity may soon be over now that the omicron wave is receding. Three markets—Houston (126), Boston (118) and Dallas (116)—had TIM Index levels that exceeded pre-pandemic levels, while another three—Manhattan (99), Denver (96) and Seattle (92)—were nearing their pre-pandemic levels. Overall, the TIM Index increased or remained stable in seven markets.
The U.S. Sublease Availability Index was unchanged in February at 196. The index has roughly stayed at this level since September 2021, down by a modest 10 points since peaking in June 2021. High sublease availability continues to hamper the U.S. office market recovery. Nine of the 12 markets recorded an increase in their sublease inventory in February, while two declined and one was flat.
U.S. Average Performance Index
Figure 1: Indexed Average Performance of Sublease Availability, TIM and Leasing Activity for the Top 12 U.S. Markets
Source: CBRE Research, February 2022.
February Demand Recovery by Market
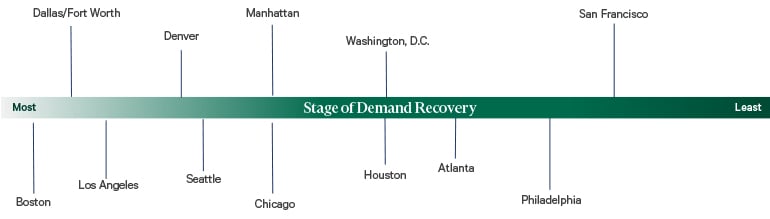
Boston, Dallas/Fort Worth and Los Angeles remained the leaders for office demand recovery in February, followed by Seattle and Denver. Continued occupier caution was most apparent in Atlanta, Houston and Manhattan, where progress toward recovery has paused. However, conditions are expected to improve as the omicron surge fades and more occupiers encourage their employees to return to the office.
Figure 2: February Office Market Recovery Scale, Top U.S. Markets
Source: CBRE Research, February 2022.
Tenants in the Market Index
Figure 3: Indexed Square Footage of Tenant Requirements Compared with 2018/2019 Average
Source: CBRE Research, February 2022.
The U.S. TIM Index1 was unchanged in February at a level of 89. The index has increased since the omicron surge in December and is at its highest level since April 2020, which indicates that the improving health situation has motivated tenants to resume their search for office space.
Three markets—Houston (126), Boston (118) and Dallas/Fort Worth (116)—had TIM levels that exceeded their pre-pandemic levels, while another three—Manhattan (99), Denver (96) and Seattle (92)—were at more than 90% of their pre-pandemic levels. Dallas/Fort Worth's index level jumped 20 points in February—the biggest month-over-month increase—and Manhattan posted an 8-point gain.
Overall, TIM levels increased in seven of the 12 markets in February, including San Francisco (+2 points) where TIMs recovery has been slow. TIM Index levels fell in the other five markets, including Denver (-10 points), Philadelphia (-10 points) and Washington, D.C. (-6 points).
Figure 4: February 2022 TIM Index–Top 12 U.S. Markets

Source: CBRE Research, February 2022.
Leasing Activity Index
Figure 5: Indexed Monthly Leasing by Market Compared with 2018/2019 Average
Source: CBRE Research, February 2022.
The U.S. Leasing Activity Index2 fell for a second consecutive month to a level of 76. The drop in activity was widespread, with leasing index levels down in 10 of the 12 markets and flat in the remaining two. Two markets—San Francisco and Seattle—had modest declines of 5 and 1 points, although they still had the highest index levels of 456 and 240, respectively.
The slowdown in leasing has persisted for four consecutive months in Washington D.C. (58), Chicago (50) and Houston (40), all of which have Leasing Index levels that are well below their pre-pandemic baselines. Despite the monthly slowdowns, a few markets maintained Leasing Index levels above their pre-pandemic baseline, including Boston (163) and Los Angeles (112). Additionally, Denver (94), Dallas/Fort Worth (93) and Seattle (91) are near their pre-pandemic levels.
The February slowdown in leasing was most evident in Atlanta (45), which recorded a substantial decline in its index level since peaking at 166 in October 2021. Manhattan’s Leasing Index level (57) has also declined after briefly reaching its pre-pandemic baseline in November and December 2021.
Figure 6: February 2022 Leasing Activity Index–Top12 U.S. Markets

Source: CBRE Research, February 2022.
Leasing Index methodology note: Leasing activity includes all new leases, expansions and renewals of 10,000 sq. ft. or more that close each month. The Leasing Activity Index uses a rolling three-month average of leasing activity. Most markets the weighted 20% for the current month, 50% for the previous month and 30% for two months prior. For New York and Boston, where more accurate leasing data is available by the end of each month, the weights are 50% for the current month, 30% for the previous month and 20% for two months prior. The monthly rolling average is compared with a pre-pandemic baseline, which is the average monthly leasing activity between 2018 and 2019. The index level for the baseline is 100.
Sublease Availability Index
Figure 7: Indexed Sublease Availability by Market Compared with 2018/2019 Average
Source: CBRE Research, February 2022.
The U.S. Sublease Availability Index level was unchanged in February at 196. While the index remains stubbornly high, it is down from the first half of 2021 as the pace of sublease additions gradually slows.
Nine of the 12 markets recorded an increase in their sublease indices in February, though the rise was a nominal 1 to 2 points in seven of those markets. Manhattan had the biggest monthly increase of 5 points in February to a level of 190, followed by a 3-point increase in Atlanta to a level of 186.
Two markets—San Francisco and Seattle—had modest declines of 5 and 1 points, although they still had the highest index levels of 456 and 240, respectively.
The surplus of sublease space will continue to weigh on the U.S. office market recovery in 2022.
Figure 8: February 2022 Sublease Availability Index–Top 12 U.S. Markets

Source: CBRE Research, February 2022.
Office Demand Expected to Stabilize
Office demand is expected to stabilize in the near term as more companies encourage employees to return to the office due to a sharp decline in COVID infections.. The improving health outlook and resurgent U.S. economy should support office leasing activity in the second half of 2022. Occupiers can capitalize on continued highly favorable market conditions due to the large sublease space glut.
1 CBRE tracks the total square footage of requirements from active tenants in the market with minimum requirement of 10,000 sq. ft. The TIM Index compares the total monthly TIM requirements to a pre-pandemic baseline, which is the average of TIM requirements recorded by CBRE in 2018 and 2019. The index level for the baseline is 100. In most cases, when tenant requirements are given as a range, the index uses the minimum square footage. However, Seattle records TIM using the average requirement within the tenants’ size range, while Philadelphia uses the maximum square footage.
2 Leasing activity includes all new leases, expansions and renewals of 10,000 sq. ft. or more that close each month. The Leasing Activity Index uses a rolling three-month average of leasing activity. Most markets are weighted 20% for the current month, 50% for the previous month and 30% for the prior two months. For New York and Boston, where more accurate leasing data is available by the end of each month, the weights are 50% for the current month, 30% for the previous month and 20% for the prior two months. The monthly rolling average is compared with a pre-pandemic baseline, which is the average monthly leasing activity between 2018 and 2019. The index level for the baseline is 100.
Related Insights
- Brief | Intelligent Investment
Omicron Impact on U.S. Office Demand Persists in January
February 17, 2022 5 Minute Read
The CBRE Pulse of U.S. Office Demand slowed in January, as occupiers paused on leasing activity in the face of the omicron surge.
- Brief | Intelligent Investment
Omicron Surge Slows U.S. Office Demand in December
January 26, 2022 5 Minute Read
The CBRE Pulse of U.S. Office Demand slowed moderately in December, likely reflecting renewed occupier caution over the COVID-19 omicron surge.
- Brief | Intelligent Investment
U.S. Office Demand Stable in November Despite COVID Concerns
December 20, 2021 5 Minute Read
The CBRE Pulse of U.S. Office Demand showed little change in November.
- Brief | Intelligent Investment
Tenant Inquiries Rise but Sublease Challenges Remain
November 22, 2021 8 Minute Read
The CBRE Pulse of U.S. Office Demand showed modest improvement in October with a notable uptick in new leasing requirements, while leasing activity and sublease...
