Figure
Canada Office Figures Q1 2026
April 1, 2026
Office market strengthens amid downtown recovery and record office building conversions
Executive Summary
- Net absorption was positive for a third consecutive quarter and led by Toronto once again. Overall, six of 11 markets reported positive net absorption at the start of 2026.
- Vacancy has continued to improve, particularly downtown where optimism has been building. Downtown vacancy declined once again across all segments in Q1, although most sharply among Class A product which is currently at its lowest level since Q3 2022.
- National sublease space has declined for an 11th consecutive quarter, reducing from its peak by a cumulative 6.5 million sq. ft. Given current trajectory, sublet space could soon fall to a level on par with averages leading into the pandemic.
- New supply this quarter includes the fully pre-leased CIBC Square II. Paired alongside record low starts, total construction has dropped to a 22-year low.
- Over 1.5 million sq. ft. of office product was removed from inventory for conversion in Q1, which is a record quarterly high. Since 2021, conversions and demolitions have helped reduce inventory by 2.5% and could outpace new supply in the year ahead.
National trend dictated by Toronto momentum
2026 started off on a strong note with 2.1 million sq. ft. of positive net absorption. Returning to pre-pandemic norms, this is the third consecutive quarter of positive office fundamentals and is the largest quarter of activity in Canada since Q2 2024.
In Q1 2026, six of 11 markets saw positive net absorption; four of those markets recording over 100,000 sq. ft.
This recent momentum has been led by Toronto, which has reported net absorption exceeding 1.0 million sq. ft. in each of the last three quarters. It is clear that Toronto has and will continue to dictate national trends.
Performance elsewhere has varied but has remained much more muted by comparison, indicating indicating that markets across the country are in different stages of recovery.
Vancouver has seen net absorption build over the last two quarters, meanwhile Halifax has continued its impressive 16-quarter streak of positive net absorption.
Ottawa in particular is the only market to be moving in the opposite direction, noting a marked slowing over the last three quarters.
Best-in-class demand propelling downtown leasing conditions
Office vacancy declined downtown across all segments once again this quarter, albeit only marginally within the Class B/C category.
Class A properties have seen a marked improvement to vacancy over the last three quarters and vacancy in the segment is currently at its lowest level since Q3 2022. Decreasing vacancy was reported in six of 11 markets in Q1 2026 and was led by Edmonton (-250 bps) and Toronto (-120 bps).
Trophy assets, the top-tier within Class A, has seen vacancy lower over the last five quarters and is currently under 10.0% for the first time since 2020. Increasingly fewer large-block vacancies remain within these in-demand assets.
The prioritization of best-in-class product has long been emphasised. However, with continued vacancy declines and an increasingly competitive environment for premium space, demand is expected to soon spillover to the next-best spaces.
Return-to-office push driving renewed optimism downtown
Building on momentum from last year, national downtown vacancy declined by 60 bps in Q1. The suburban market meanwhile saw vacancy hold from Q4 2025.
Continued improvement downtown has seen the delta between downtown/suburban inventory narrow to 180 bps, which is currently at a two-year low.
Initially led by Toronto, rising return-to-office expectations are starting to result in renewed sense of optimism downtown for year ahead.
Declining vacancy downtown was seen in seven of 11 markets. Halifax (-220 bps), Toronto (-110 bps) and Winnipeg (-100 bps) noted the largest changes, with Halifax benefiting from two vacant properties removed for conversion.
Ottawa, meanwhile, has experienced a noted slowing as total vacancy increased 100 bps, primarily due to large blocks of federal vacancies coming to market.
Sublease space closing in on pre-pandemic average
National sublease space has declined for an 11th consecutive quarter, down 774,000 sq. ft. in Q1 2026, for a cumulative total reduction of 6.5 million sq. ft. from its peak.
10.7 million sq. ft. of sublet space remains available for lease nationally, which is on par with early 2018. Given current trajectory, sublet space could fall later this year to a level that is aligned with the three-year average leading into the pandemic.
Toronto led the decrease once again this quarter on a square footage basis, followed by Vancouver.
Outside of Calgary, Toronto and Montreal, sublet space has been largely stable with all remaining markets reporting current totals that are within +/- 75,000 sq. ft. of their respective prior four-quarter rolling averages.
Calgary is the only notable outlier, having now seen sublease space rise for a full year, related to M&A activity and rightsizing efforts within the energy sector.
New supply boom in Q1 to slow beyond 2026
No new office projects commenced construction this quarter, following recent trend of increasingly limited starts.
1.6 million sq. ft. of new supply was delivered to the market in Q1 2026, well exceeding the total over 2025. CIBC Square II in Toronto accounted for the bulk of this inventory. Fully pre-leased, tenants will take initial occupancy across low and mid-rise floors in the coming weeks.
An additional 911,000 sq. ft. of office inventory is anticipated for delivery over the remainder of 2026 for an annual total of 2.5 million sq. ft.
Due to limited starts, the thinning pipeline of new supply is expected to remain constrained. With no meaningful new supply deliveries on the horizon beyond 2026, demand is soon expected to trickle down to the next-best product tiers.
Office construction thins to new 22-year low
The national office construction pipeline has fallen to 1.6 million sq. ft. following the completion of CIBC Square II and is equal to only 0.3% of existing inventory. This is a historic low for Canada that has been unmatched for 22-years.
Despite the lean level of construction, the total national pipeline is presently only 29.6% pre-leased. Halifax currently has the highest level of pre-leasing, amounting to 62.5%, followed by Victoria with 46.1%.
Outside of Toronto, no meaningful product is being built downtown and is the first time since 2012 in which the supply pipeline is primarily suburban. Very conservative levels of suburban product are underway with no more than four active projects in a single city.
Record low levels of construction will see conversions and demolitions outpace new supply once again this year and were roughly on par with one another in Q1 2026.
Conversions reach record high, with hotel repurposing on the rise
Seven office conversion projects moved forward at the start of 2026 removing nearly 1.5 million sq. ft. from competitive inventory. This is the highest quarter on record for conversion activity based on square footage.
Activity was quite widespread with Calgary and Halifax each seeing two properties removed this quarter, along with single projects in Vancouver, London and Toronto.
Hotels are gaining traction and are now the second most prevalent new property type for conversion projects. Planned hotel conversions removed from inventory in Q1 2026 include 1111 W Hastings Street in Vancouver and 1 Yonge Street (former Toronto Star building) in Toronto which was initially slated for demolition.
Since 2021, conversions have removed a cumulative 9.3 million sq. ft. of office space from inventory. An additional 2.7 million sq. ft. has been demolished over the same period. Together, they have reduced national inventory by 2.5%, removing properties otherwise facing potential obsolescence.
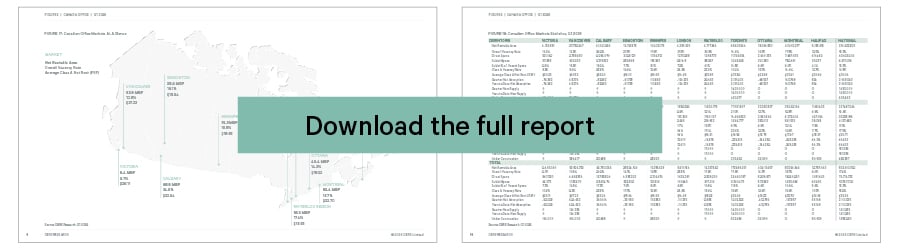
Local Market Insights
Explore regional office statistics in Victoria, Vancouver, Calgary, Edmonton, Winnipeg, London, Waterloo Region, Toronto, Ottawa, Montreal, and Halifax.
Want to receive future reports? | Sign up here.
Contacts


Stay in the Know
Stay up to date on relevant trends and the latest research.