Intelligent Investment
Tech-30 2021
Measuring the Tech Industry’s Impact on U.S. & Canada Office Markets
October 27, 2021 20 Minute Read

Looking for a PDF of this content?
Tech-30 explores the tech industry’s impact on office space and ranks the 30 leading tech markets in the U.S. and Canada, as well as 10 up-and-coming tech markets.
Insights from the Tech-30 Expert Roundtable
Our Expert Roundtable event on Nov. 16, 2021, highlighted key findings from the report and featured a panel discussion covering a wide range of topics, including how the tech industry’s growth and resilience is impacting office markets, the latest on tech employers’ plans to return to the office and ESG’s growing importance for both investors and occupiers.
Featured Speakers
Owen D. Thomas - CEO and Director, Boston Properties
Steve Brashear - Senior Vice President, Global Real Estate, Salesforce
Colin Yasukochi - Executive Director, CBRE Tech Insights Center
Moderator
Darcy Stacom - Chairman, Head of NYC Capital Markets, CBRE
How is the tech industry performing and where is it headed?
Tech products and services have been essential for business continuity in the COVID-19 era, resulting in robust tech job growth over the past 12 months. This in turn has led to the tech industry powering the early-stage office market recovery.
Which are the top markets for high-tech job growth in 2019-2020?
Toronto +26%
Toronto led all Tech-30 markets for job growth in 2019-2020, followed by Seattle (+22%), Vancouver (+21%), New York (+18%) and Austin (+16%).
Which are the top momentum markets with faster tech job growth in the past two years than in the prior two years?
Indianapolis +12 percentage points
Indianapolis led all Tech-30 markets for faster tech job growth in 2019-2020 vs. 2017-2018, followed by Pittsburgh (+8 points), Charlotte (+6 points), Philadelphia (+6 points) and Raleigh-Durham (+5 points).
How are tech office markets performing?
Rents stabilize
Tech-30 markets in aggregate saw average office rents stabilize and in their top tech submarkets. Over the past two years, four overall markets and nine submarkets had double-digit rent growth. Net absorption was positive in six overall markets and 12 submarkets.
Which tech markets are most at risk from rising sublease space?
+90% sublease
Aggregate sublease space availability in Tech-30 markets has increased by 90% since March 2020. Tech companies are responsible for 23% of the 134 million sq. ft. of currently available sublease space. San Francisco has the most risk, followed distantly by Seattle, Austin and Chicago.
Which tech markets are most resilient & poised for growth?
Charlotte
Charlotte has the best combination of tech job growth and momentum, office market performance and demand recovery among Tech-30 markets. Montreal, New York, Phoenix, Pittsburgh, Raleigh-Durham, Seattle, Silicon Valley, Toronto and Vancouver rounded out the top 10.
How diverse is the tech industry?
33% Female
18% Hispanic/Black/Other
U.S. tech industry diversity by race, ethnicity and sex has improved modestly over the past five years but remains mostly Male (67%), White (61%) and Asian (21%). Females (33%) and Hispanics, Blacks and Other races (18%) are underrepresented compared with non-tech office-using industry employment, where these groups comprise 51% and 26%, respectively.
Figure 1: U.S. workforce by race/ethnicity & sex for selected industries, 2019
Source: U.S. Census, IPUMS and CBRE Research, May 2021.
Note: Office-using industries include information, financial activities and professional & business services (excluding tech industry within these categories).
For related research, please see Scoring Tech Talent.
How is the tech industry performing and where is it headed?
Technology business and employment growth are contributing to economic expansion and leading a rebound in office demand. U.S. high-tech software and services employment grew by 1.5 million jobs between 2010 and February 2020, which accounted for one of every four new office-using jobs. When the COVID-19 economic downturn took hold, many high-tech companies put expansion plans on hold and some were forced to conserve capital and reduce headcounts.
After a modest decline in high-tech employment from February to May 2020, growth resumed with 219,000 jobs added by June 2021. Total high-tech employment was 3.9 million in June 2021, 3.3% above its pre-pandemic high. Much of this growth was attributable to large tech companies benefiting from pandemic-related business growth in sectors such as e-commerce, streaming and cloud services, search and social media. While jobs in other industry sectors have rebounded more vigorously from their 2020 lows, most sectors have not fully recovered. Office-using employment, excluding high-tech, and overall U.S. employment remain 1.6% and 2.9% below their pre-pandemic highs (Figure 2). The life sciences industry, another beneficiary of pandemic-related business growth, outpaced the high-tech industry with current employment 6.9% above its prepandemic high.
Total high-tech employment was 3.9 million in June 2021, 3.3% above its pre-pandemic high.
Figure 2: U.S. job growth for high-tech & creative industries
Source: U.S. Bureau of Labor Statistics and CBRE Research, August 2021.
Employment growth has resumed across most business sectors. Coupled with pent-up demand, this has led to a rebound in office leasing activity. Office leasing volume, which averaged 60 million sq. ft. per quarter in 2019, fell sharply during 2020 and appeared to bottom out at 31 million sq. ft. in Q1 2021 (Figure 3). The tech industry’s share of office leasing activity dropped to 17% in 2020 from 22% in 2019. Compared with Q1 2021, tech leasing over the next two quarters surged by an average of 122%, resulting in a 22% share of the 95 million sq. ft. leased during Q2 and Q3 2021.
High-tech companies in the San Francisco Bay Area, Seattle, Boston, Los Angeles, Phoenix and Austin are leading the rebound. There has also been a shift in the type of office lease transactions occurring in the U.S. The economic downturn led to a 90% increase in sublease space since early 2020 as companies reduced headcounts and growth expectations. Occupiers looking for greater cost efficiency caused sublease’s share of total leasing volume by square footage to hit a high of 15% in Q3 2021 (Figure 4). The sublease share averaged 6% between 2017 and 2019. Additionally, the share of new landlord direct leases began to increase in 2021, a reversal from the significant decline in 2020 associated with tenants delaying non-essential leasing decisions. This increase in new direct deals suggests improved tenant confidence in their growth plans and utilization of office space.
High-tech companies in the San Francisco Bay Area, Seattle, Boston, Los Angeles, Phoenix and Austin are leading a rebound in office leasing activity.
Figure 3: U.S. office leasing activity & tech industry share
Note: Leasing activity includes the top 50 markets tracked by CBRE Research. Source: CBRE Research, Q3 2021.
Figure 4: U.S. office leasing activity by transaction type
Note: Leasing activity includes the top 50 markets tracked by CBRE Research. Source: CBRE Research, Q3 2021.
Job creation has traditionally driven office demand. While that’s not expected to change, the ongoing shift to increased hybrid and remote work arrangements largely embraced by the high-tech industry and adopted by many other industries may have lasting impacts on future office demand. The potential for decreased office space allocations per employee likely will be offset over time by new job creation above prepandemic levels, which has already occurred in the tech industry.
The office remains an important place for workers to collaborate, connect and participate in workplace culture. Nevertheless, the virtual environment is recognized as a strong substitute at least some of the time. This push and pull likely will evolve over the coming years, setting a new baseline for office space demand per employee.
High-tech industry growth prospects remain strong as beneficial pandemic induced business trends are expected to endure and accelerate economic transformation. Performance of the tech-heavy Nasdaq Index since mid-2020 indicates that future business and earnings potential has tremendous upside. The Nasdaq is strongly correlated to high-tech job growth and provides a one-year leading indicator. Venture capital investment, which similarly indicates future job creation for smaller companies, surged to a record annual high of $133 billion in 2020 and already has surpassed that total in 2021 as of Q3.
Tech-30 markets and their most tech-concentrated submarkets will benefit from tech industry growth trends that likely will be least affected by evolving remote and hybrid work arrangements. Tech jobs have surpassed pre-pandemic highs and future growth is expected to outpace many other office-using industries.
High-tech industry growth prospects remain strong as beneficial pandemic induced business trends are expected to endure and accelerate economic transformation.
Which are the top-growth tech cities?
The Tech-30 are the leading technology markets in the U.S. and Canada that have experienced considerable growth over the past decade, fueled by rapid innovation to drive productivity and advance digital lifestyles. High-tech employment quickly rebounded after a modest decline in early 2020. By year-end, tech job growth surpassed its pre-pandemic high in most markets. High-tech jobs proved resilient and supported most Tech-30 markets.
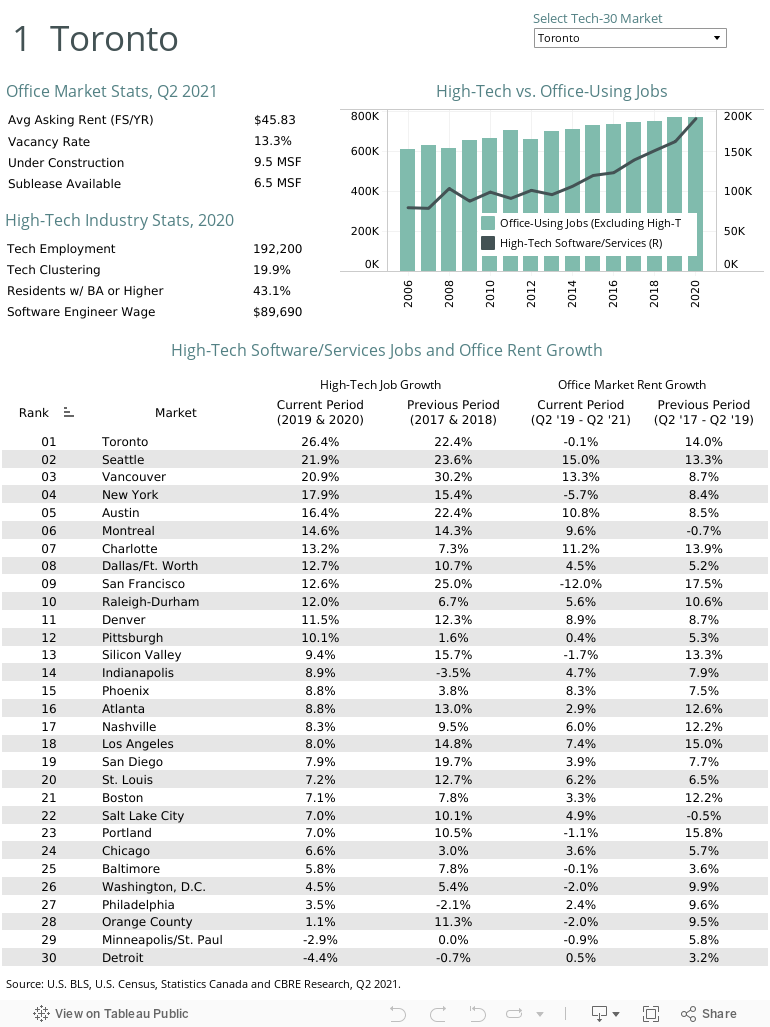
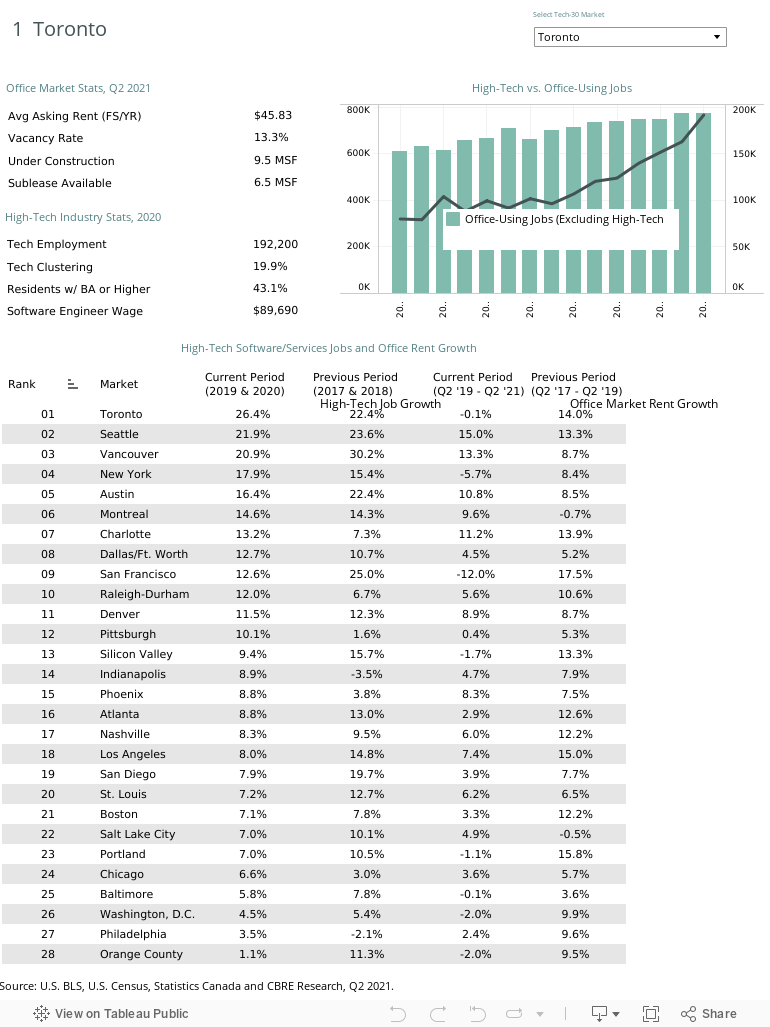
Aggregated high-tech software/services job growth of 11.3% for Tech-30 markets outperformed the 7.5% U.S. average over the past two years. Among these markets, 19 exceeded the U.S. high-tech job growth rate in 2019 and 2020. Toronto was the top high-tech job growth market at 26% (Figure 5). Comparing the past two years (2019 and 2020) with the prior two years (2017 and 2018), 11 markets posted the same or faster growth, including Toronto, New York, Montreal, Charlotte, Dallas and Raleigh-Durham. Of the 19 markets with slower growth during these comparison periods, job growth was still strong. Among these were Seattle, Vancouver, Austin, San Francisco and Denver.
Figure 5: High-tech software/services job & office rent growth, past two years
Source: U.S. Bureau of Labor Statistics, Statistics Canada, CBRE Research, Q2 2021.
Tech job growth is strongly correlated with office rent growth in Tech-30 markets, with four markets posting rent growth of 10% or more between Q2 2019 and Q2 2021—Seattle, Vancouver, Charlotte and Austin, followed by high single-digit growth in Montreal, Denver, Phoenix and Los Angeles (Figure 6.1). Office rents also increased by 10% or more in four primary tech submarkets between Q2 2019 and Q2 2021—Oakland/East End in Pittsburgh, Downtown West in Toronto, Lake Union in Seattle and Far North in Dallas (Figure 6.2). The top submarkets for net absorption during this period were RTP/I-40 Corridor in Raleigh-Durham, Hillsboro in Portland, South Valley/Utah County North in Salt Lake City, Northeast in Charlotte and Oakland/East End in Pittsburgh (Figure 6.4).
Comparing the past two years with the prior two years, 11 markets posted the same or faster tech job growth.
Figure 6.1: Rent growth overall market
Q2 2021 vs. Q2 2019
Source: CBRE Research, Q2 2021.
Figure 6.2: Rent growth top tech submarket
Q2 2021 vs. Q2 2019
Source: CBRE Research, Q2 2021.
Figure 6.3: Net absorption growth overall market
Q3 2019 – Q2 2021 (% of total building inventory)
Source: CBRE Research, Q2 2021.
Figure 6.4: Net absorption growth top tech submarket
Q3 2019 – Q2 2021 (% of total building inventory)
Source: CBRE Research, Q2 2021.
Spreading growth across U.S.
Tech companies began major expansions beyond their headquarter markets in 2013 to tap into broader talent pools as their workforce grows. Bay Area based tech companies led this charge, signing more than 35 million sq. ft. of office leases in 10 other markets where they were most active since 2013. By pioneering the technology for remote working, these companies have fared better than others during the COVID downturn. This strategy is more relevant and important today with increased remote work and the need for geographically dispersed workplaces and hubs for in-person collaboration. Companies based in other markets also expanded in the Bay Area for similar reasons, with the largest amounts coming from Seattle (2.4 million sq. ft.), Boston (1.2 million sq. ft.) and New York (600,000 sq. ft.).
Figure 7: Tech company expansion into diversified U.S. markets
Source: CBRE Research, includes lease transactions from Q1 2013 to Q2 2021.
Tech submarkets outperform
Leading tech submarkets often outperform their overall office markets because tenants are willing to pay a premium in areas preferred by tech talent. Many of these submarkets have limited office availability and are near leading universities. The top tech submarkets with the lowest vacancy rates as of Q2 2021 were Ann Arbor in Detroit (6.7%), East Cambridge in Boston (6.8%), University City in Philadelphia (7.7%), South Lake Union in Seattle (7.9%) and RTP/I-40 Corridor in Raleigh-Durham (8.4%).
The tech industry’s prominence in these submarkets appears to have impacted rents more than their overall markets due to reduced leasing activity (Figure 8). Average rental rates for top tech submarkets have increased faster than their overall markets since 2011 and have a 23% premium as of Q2 2021 despite recent rent declines. Some markets are significantly higher, such as East Cambridge (114%), Palo Alto (66%) and Santa Monica (63%). Several emerging tech submarkets have rent discounts, such as Hillsboro in Portland (-23%), Northeast Charlotte (-20%) and St. Louis CBD (-18%).
Figure 8: Markets & submarkets aggregate annual average asking rent
Source: CBRE Research, Q2 2021.
Sublease space on high plateau, beginning to decrease in some markets
High-tech companies have dominated the leasing of office space over the past five years after creating 1.6 million new jobs since 2010. This increased the high-tech industry’s share of leasing activity by square footage to 22% in 2019 from 12% in 2010.
Concerns of over-leasing by the high-tech industry in anticipation of further job growth proved unfounded until the COVID-19 pandemic changed growth and occupancy dynamics for much of 2020. While this was not isolated to the high-tech industry, it was more pronounced in certain tech-oriented markets.
Available sublease space in Tech-30 markets began rising in 2020 amid reduced tenant demand. Surplus office space increased by 90% to 136 million sq. ft. from 71 million sq. ft. between Q1 2020 and Q2 2021 (Figure 9). The rise in available sublease space varies considerably by market and is directly associated with the concentration of tech companies that are venture-capital-backed, that serve severely weakened economic sectors and that choose remote-first or significant hybrid work arrangements. Sublease availability levels as of August 2021 indicated that the amount of space on the market may be at or near its pandemic peak.
Figure 9: Tech-30 aggregate available sublease office space
Note: Leasing activity includes the top 50 markets tracked by CBRE Research.
Source: CBRE Research, Q3 2021.
Tech companies currently account for 23% of available sublease space across Tech-30 markets, up from 14% in 2019. Potential risk in these markets stems from tech companies that have either leased more space than they currently need or are downsizing due to job cuts or permanent shifts to fully remote or hybrid working.
Sublease concentration and saturation are key variables that influence the potential risk that sublease availability poses to office market fundamentals. The “Sublease Risk Radar” (Figure 10) plots sublease space growth and tech concentration against the saturation of sublease availability. The overall risk across Tech-30 markets is medium-high, with a 3.6% sublease availability rate of total inventory. Markets with a high concentration of tech, rising sublease space inventory and a high sublease availability rate—those in the upper right corner of the radar—have a medium to high level of risk that sublease space will weaken market fundamentals.
Figure 10: Sublease risk radar | tech office markets
Overall risk level: medium-high (Q2 2021)

Note: Sublease Risk Radar measures the relative risk of tech sublease dispositions across top markets with available data, Sublease Growth/Tech Concentration is a function of sublease inventory growth over the past year and the concentration of disposed tech subleases during Q2 2021. Sublease Availability is the portion of total market inventory available for sublease. The quadrant lines represent the aggregate average for each measure.
Source: CBRE Research, Q2 2021.
San Francisco is at the highest position on the risk spectrum with a 10.6% sublease availability rate and the highest concentration of sublease availability from tech companies. Other markets with higher-than-average risk—those with above average growth in the amount of sublease availability over the past year—include Seattle, Austin and Chicago.
High-tech companies have dominated the leasing of office space over the past five years after creating 1.6 million new jobs since 2010. This increased the high-tech industry’s share of leasing activity by square footage to 22% in 2019 from 12% in 2010.
Market cycle positioning
Real estate cycles influence investment and occupancy decisions. Markets generally move across four cycle phases at varying degrees, with some remaining in one cyclical phase for an extended period. In aggregate, the Tech-30 moved from the maturation/stable phase of the office market cycle last year to the contraction phase in Q2 2021, characterized by weakened demand, rising supply and falling rents (Figure 11). Some markets did not contract significantly, while others have already entered the stabilization phase.
In aggregate, the Tech-30 moved from the maturation/stable phase of the office market cycle last year to the contraction phase in Q2 2021, characterized by weakened demand, rising supply and falling rents.
Figure 11: Tech-30 office market cycle

Source: CBRE Research, Q2 2021.
The high-tech industry’s resilience and its integration with other industries to fuel growth and productivity have led to its outperforming the overall economy in terms of job growth. This likely will continue in the years ahead as pandemic related business and personal uses of technology have accelerated the economy's digital transformation.
Given the high-tech industry’s impact on the U.S. economy and real estate demand, keeping track of and understanding the industry’s most reliable indicators is important. CBRE finds that financial market trends are the most informative indicators of the high-tech industry’s growth prospects.
Capital availability has historically presaged future growth prospects for the high-tech industry. At the early stages of tech company growth, venture capital funding is the key indicator of business formation. Thus, the availability and flow of venture capital fuels business and employment growth for private tech companies. Capital flowing into venture funds and to venture-backed companies has been very high in recent years.
According to Price Waterhouse Coopers and CB Insights, venture capital funding in the U.S. has been increasing since 2010 (Figure 12). In the months after the COVID-19 economic shutdown, venture capitalists invested in companies that facilitate remote working, e-commerce and digitalization technologies. They have also provided additional funding for companies to bridge reduced revenue projections. These investments resulted in record-high funding of $133 billion last year. Year-to-date in 2021 through August, $170 billion of venture capital funding has been allocated. Full-year 2021 funding is on pace to surpass $200 billion—50% more than last year’s record total.
Figure 12: U.S. venture capital funding
Source: PwC/CBInsights MoneyTree and CBRE Research, August 2021.
Share prices are a good barometer of growth prospects for publicly traded tech companies. Because most tech companies are listed on the Nasdaq stock exchange, the Nasdaq Index has become a reliable indicator of business and employment activity. Analysis of high-tech employment patterns suggests that the Nasdaq Index acts as a 12-month leading indicator of employment levels at a robust 93% correlation (Figure 13). The extraordinary rise of the Nasdaq after hitting its low in March 2020 indicates that future earnings potential has tremendous upside and investors remain confident in the high-tech industry.
Figure 13: NASDAQ vs. tech employment

Source: NASDAQ, U.S. Bureau of Labor Statistics and CBRE Research, August 2021.
Combined, the Nasdaq performance and venture capital investment trends should translate into future high-tech employment growth and office space demand.
The longest bull stock market in history ended in March 2020 but share prices have quickly rebounded, primarily from a surge in large-cap tech stocks benefiting from digital trends accelerated by the pandemic. By August 2021, the S&P 500 Index was more than 30% above its pre-pandemic high, raising concerns that stock market valuations may be stretched and a correction might occur.
The Shiller S&P 500 Cyclically Adjusted Price-to-Earnings Ratio (CAPE) measures the broader equity market and is an important metric for gauging the economy’s overall health and the financing environment. Historically, an above-average ratio has preceded significant financial market corrections. The CAPE ratio decreased by 18% in March 2020 from the steady average of 30 in 2019—much less than the 53% drop in 2009. It has not only rebounded fully, but at 39 in August 2021 the CAPE is approaching the dot-com bubble high of 44 in 2000.
Figure 14: Shiller S&P 500 cyclically adjusted price-to-earnings ratio (cape ratio)

Source: Shiller PE Ratio, August 2021.
Meanwhile, the Nasdaq was 57% above its pre-pandemic peak as of August 2021 and more than 200% above its dot-com peak, with gains driven by a small number of large-cap tech companies. During the pandemic, the tech industry became indispensable in accelerating the digital economy, resulting in strong earnings growth that increased stock valuations.
These companies were major consumers of office space and with earnings driving their employment growth higher, they are once again leading the rebound in leasing activity. The high-tech industry’s growth leadership likely will endure and continue to generate significant office demand, benefiting many of the Tech-30 markets in the years ahead.

Source: U.S. Bureau of Labor Statistics, Statistics Canada, CBRE Research, Q2 2021.
Related Insights
Adopting a hybrid approach to work can impact everything from organizational policies and occupancy planning to office design, tech investments and more.
Related Services
- Industries
Tech, Communications & Entertainment
We provide proactive real estate solutions for technology, media and telecommunication companies at every stage.
- Services
Plan, Lease and Occupy
Drive value and growth with consulting and transaction services that align with your strategic goals.
- Manage Properties and Portfolios
Property Management
Maximize property performance with innovative management solutions, cutting-edge technology and unique amenities.
2021 Tech-30

Occupier Services
Manish Kashyap
Global President, Leasing, Advisory Services

Whitley Collins
Global President, Strategic Occupier Accounts

