Intelligent Investment
Tech-30 2022
Measuring the tech industry’s impact on U.S. & Canada office markets
October 31, 2022 10 Minute Read

Key Takeaways
Looking for a PDF of this content?
Tech-30 explores the tech industry’s impact on office space and ranks the 30 leading tech markets in the U.S. and Canada, as well as 10 up-and-coming tech markets.
-
How is the tech industry performing and where is it headed?
Tech industry job growth remains well above the national average. Economic headwinds in the year ahead likely will slow but not end high-tech job growth.
2.0M
jobs created since 2010
476K
jobs created since February 2020
-
Which are the top markets for high-tech job growth?
Two Canadian markets had the most high-tech job growth in 2020 and 2021 combined, followed by Austin in the U.S. Eight other U.S. markets surpassed the 9.8% national average, including Seattle, Denver and Raleigh-Durham.
Vancouver
+44%
Toronto
+37%
Austin
+25%
-
Which are the top momentum markets with faster high-tech job growth?
Thirteen markets had faster high-tech job growth in the past two years than in the prior two years, led by Toronto and Montreal in Canada and Minneapolis and Raleigh-Durham in the U.S. None of the major headquarters or gateway cities were among the strongest momentum markets, as job growth was more distributed geographically.
Toronto
+20 percentage points
Montreal
+18 percentage points
Minneapolis
+8 percentage points
Raleigh-Durham
+7 percentage points
-
How are tech office markets performing?
U.S. leasing activity by the tech industry has stabilized but remains 35% below pre-pandemic levels. Sublease space across the Tech-30 is elevated at 3.8% of available space. Rents in 23 markets were higher in Q2 2022 than two years ago. Only six Tech-30 markets overall and eight submarkets recorded positive net absorption over the past two years.
Stable
Leasing activity and sublease space stable
-
Which tech markets are most resilient and positioned for renewed growth?
These markets have the best combination of future tech demand drivers and office market fundamentals.
Vancouver
Boston
Silicon Valley
Raleigh-Durham
San Diego
-
How diverse is the tech industry?
U.S. tech industry diversity by race, ethnicity and sex has improved modestly over the past five years but remains mostly male (67%), White (57%) and Asian (20%). Females (33%) and Hispanics, Blacks and other races (23%) are underrepresented compared with non-tech office-using industry employment, where these groups comprise 52% and 27%, respectively.
Figure 1: U.S. Workforce by Race/Ethnicity & Sex for Selected Industries, 2020
Note: Office-using industries include information, financial activities and professional & business services (excluding tech occupations within these categories).
Sources: U.S. Census, IPUMS and CBRE Research, May 2022.33%
Female
23%
Hispanic/Black/Other
Market Data
How is the tech industry performing and where is it headed?
Tech industry business and job growth remains well above the U.S. and Canadian national averages. Economic headwinds in the year ahead likely will slow but not end high-tech job growth.
Figure 2: U.S. Annual Job Cut Announcements
Source: Challenger, Gray & Christmas, Inc., September 2022.
U.S. high-tech software and services employment growth slowed to 2.1% in H1 2022 from 4.5% in H2 2021. Job cut announcements in 2022 remain low by historical standards but are rising and concentrated in the tech industry, according to job search firm Challenger, Gray & Christmas (Figure 2). Through August 2022, approximately 40,000 tech industry layoffs have been announced, representing less than 1% of total tech industry employment.
The slowdown in high-tech industry employment growth remains moderate in the context of longer-term trends. U.S. high-tech software and services employment grew by 1.5 million jobs between 2010 and February 2020, which accounted for one of every four new office-using jobs. When the COVID-19 economic shutdown began in March 2020, many high-tech companies stopped hiring and some even reduced headcounts. But only two months later, high-tech employment growth resumed and by June 2022 approximately 76,000 jobs had been added, accounting for one of every three new office-using jobs.
Total U.S. high-tech employment
was 4.3 million in June 2022
12.6% above its pre-pandemic high
Much of this growth was attributable to large tech companies benefiting from pandemic-related business growth. In comparison, total U.S. employment was 0.4% below its pre-pandemic high and office-using employment was 4.5% above its pre-pandemic peak (Figure 3). The life sciences industry, another beneficiary of pandemic-related business growth, outpaced the high-tech industry with total employment 15.5% above its pre-pandemic high.
Figure 3: U.S. Job Growth for High-Tech & Creative Industries
Source: U.S. Bureau of Labor Statistics and CBRE Research, August 2022.
The relationship between job creation and office demand has changed with the increase in hybrid and remote work arrangements. While the average number of days office workers physically go to their employer’s workplace is still evolving, the expectation is for less office space demand per new job compared with pre-pandemic levels. It appears that the high-tech industry has embraced these trends more than other industries.
The expectation is for less office space demand per new job compared with pre-pandemic levels. The high-tech industry appears to have embraced these trends more than other industries.

Figure 4: U.S. Office Leasing Activity & Tech Industry Share
Note: Leasing activity includes direct, sublease and renewal transactions ≥ 10,000 sq. ft. in the top 50 markets tracked by CBRE Research.
Sources: CBRE Research and CBRE Tech Insights Center, Q2 2022.
Total U.S. office leasing across all industries was up by 28% year-over-year in H1 2022, while tech industry leasing grew by just 1% (Figure 4). This decreased the tech industry’s share of total office leasing to 16% in H1 2022 from 21% in 2021. In the nine quarters since the pandemic (Q2 2020 to Q2 2022), 476,000 high-tech jobs were added and 54 million sq. ft. of new office leases were signed by tech companies (renewals excluded). In the nine quarters prior to the pandemic (Q1 2018 to Q1 2020), 381,000 high-tech jobs were added and 79 million sq. ft. of new office leases were signed by tech companies.
This could portend significant pent-up office space demand once economic conditions strengthen and the amount of space needed per employee normalizes at a higher level than during the pandemic. Nearly all employers recognize that the office remains an important place for workers to collaborate, connect and participate in company culture.
Long-term growth prospects for the tech industry remain strong as global economies continue their digital transformation and as the need for technology products and services increases. High inflation and interest rates have created headwinds that likely will reduce economic growth and job creation through mid-2023. Leading indicators for the tech industry, including the Nasdaq Index and venture capital funding, remain well above pre-pandemic levels despite significant declines in 2022. This suggests some short-term volatility in growth amid tighter capital markets, while keeping long-term growth prospects intact.
Nearly all employers recognize that the office remains an important place for workers to collaborate, connect and participate in company culture.
Which are the top-growth tech cities?
The Tech-30 comprises the leading tech markets in the U.S. and Canada with the most growth over the past decade, fueled by rapid innovation to drive productivity and advance digital lifestyles.
High-tech employment, which declined minimally in the early months of the pandemic, has grown steadily since May 2020 to surpass pre-pandemic highs.

High-tech software and services job growth patterns changed because of remote work and shifting migration patterns over the past two years. The U.S. and Canada grew their high-tech employment by 9.8% and 29.4%, respectively, in 2020 and 2021. In aggregate, the Tech-30 markets grew their two-year high-tech employment by 10.8% (Figure 5). Eleven of them exceeded their national high-tech job growth rate, including Vancouver, Toronto, Austin and Seattle. Eighteen others in the U.S. and one in Canada did not exceed their national averages, including the major tech headquarter markets of Silicon Valley and San Francisco and major gateway markets of Boston and Washington, D.C.
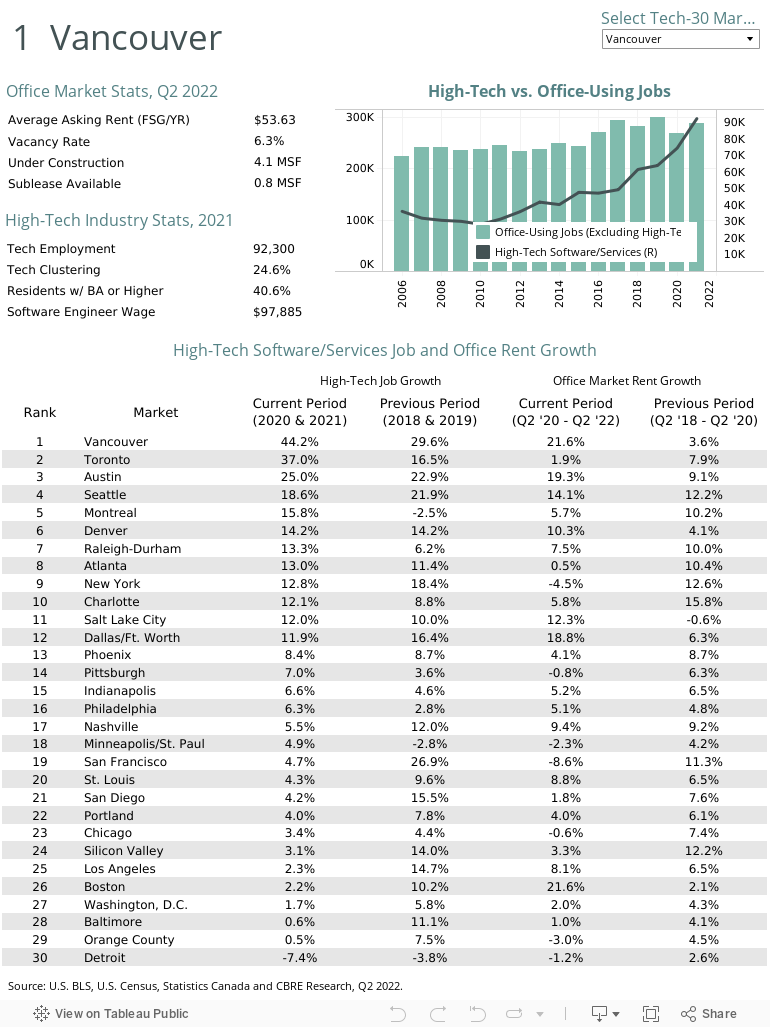
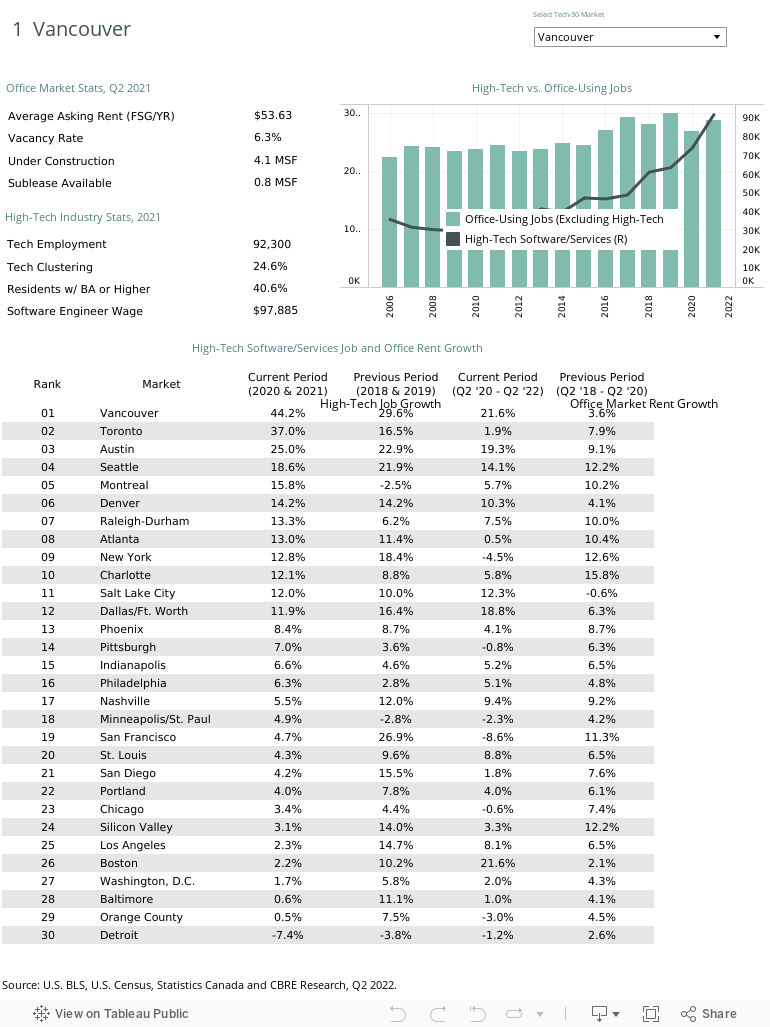
Figure 5: High-Tech Software/Services Job & Office Rent Growth, Past Two Years
Sources: U.S. Bureau of Labor Statistics, Statistics Canada, CBRE Research, Q2 2022.
These growth patterns indicate a broader geographical distribution of job creation away from headquarters locations. Tight labor market conditions and the pandemic both contributed to employers becoming more flexible on where employees can work, which will have future implications for these office markets.
Vancouver had the highest high-tech job growth at 44.2% and Toronto created the most jobs (60,400) over the past two years (Figure 5). Comparing the past two years (2020 and 2021) with the prior two years (2018 and 2019), 13 markets posted the same or faster growth, including Austin, Montreal, Denver, Raleigh-Durham, Minneapolis/St. Paul and Atlanta. Most of the 17 markets with slower growth during these comparison periods still saw strong high-tech job growth. For several markets, including Nashville and Washington, D.C., slower job growth was a return to normalcy following outsized growth that resulted from major tech company expansions and relocations.
High-tech job growth is strongly correlated with office rent growth in Tech-30 markets.
Seven markets posted rent growth of 10% or more between Q2 2020 and Q2 2022: Vancouver, Boston, Austin, Dallas/Ft. Worth, Seattle, Salt Lake City and Denver. Nashville, St. Louis, Los Angeles and Raleigh-Durham saw high single-digit growth (Figure 6.1).
Office rents also increased by 10% or more in eight primary tech submarkets between Q2 2020 and Q2 2022, led by increases of 18% for University City in Philadelphia and 16% for the CBD of Nashville (Figure 6.2). The top submarkets for net absorption during this period were the CBD of Nashville, Broadway Corridor in Vancouver, Hillsboro in Portland, RTP/I-40 Corridor in Raleigh-Durham and Oakland/East End in Pittsburgh (Figure 6.4).

Figure 6.1: Rent Growth Overall Market Q2 2022 vs. Q2 2020
Source: CBRE Research, Q2 2022.

Figure 6.2: Rent Growth Top Tech Submarket Q2 2022 vs. Q2 2020
Source: CBRE Research, Q2 2022.
Figure 6.3: Net Absorption Growth Overall Market Q3 2020 - Q2 2022 (% of Total Building Inventory)
Source: CBRE Research, Q2 2022.

Figure 6.4: Net Absorption Growth Top Tech Submarket Q3 2020 - Q2 2022 (% of Total Building Inventory)
Source: CBRE Research, Q2 2022.
Spreading growth across U.S.
Many tech companies began major expansions beyond their headquarter markets in 2013 to tap into broader talent pools (Figure 7). San Francisco Bay Area-based tech companies led this charge, signing more than 37 million sq. ft. of office leases in 10 other markets since 2013. By pioneering the technology for remote working, these companies have fared better than others during the COVID downturn. This strategy is more relevant and important today with increased remote work and the need for geographically dispersed workplaces and hubs for in-person collaboration. Companies based in other markets also expanded in the Bay Area for similar reasons, with the largest amounts coming from Seattle (3.0 million sq. ft.), Boston (1.2 million sq. ft.) and New York (650,000 sq. ft.).
Leasing growth slowed in 2022 relative to past years. Total leasing activity outside of headquarter markets since 2013 was 50 million square feet as of Q2 2022, most of it taking place in 2018 and 2019. It was 47 million square feet as of Q2 2021 and 43 million square feet as of Q2 2020.
Figure 7: Tech Company Expansion into Diversified U.S. Markets
Source: CBRE Research, includes lease transactions from Q1 2013 to Q2 2022.
Tech submarkets outperform
Leading tech submarkets often outperform their overall office markets because many tenants are willing to pay a premium in areas preferred by tech talent. Many of these submarkets have limited office availability and are near leading universities. The top tech submarkets with the lowest vacancy rates as of Q2 2022 were East Cambridge in Boston (5.3%), Broadway Corridor in Vancouver (6.4%), Oakland/East End in Pittsburgh (8.1%), University City in Philadelphia (8.4%), South Orange County in Orange County (9.2%) and Sorrento Mesa in San Diego (9.8%).
The tech industry’s prominence in these submarkets continues to place upward pressure on rents, despite less leasing activity (Figure 8). Average rental rates for top tech submarkets have remained higher than their overall markets since 2011 and have a 10.5% premium as of Q2 2022 despite a dip in top tech submarket rents during the pandemic. Rents in some top tech submarkets are significantly higher, such as East Cambridge in Boston (87%), Santa Monica in Los Angeles (59%), University City in Philadelphia (56%) and Palo Alto in Silicon Valley (50%). Several tech submarkets have rent discounts, such as Hillsboro in Portland (-25%), Reston/Herndon in Washington, D.C. (-19%), Northeast Charlotte (-19%) and St. Louis CBD (-18%).
Figure 8: Tech-30 Markets & Submarkets Aggregate Annual Average Asking Rent
Source: CBRE Research, Q2 2022.

Growth and occupancy dynamics have evolved since the start of the pandemic, causing many office space occupiers to reassess their portfolio needs.

Elevated sublease space remains a market risk
Tech has leased the most office space of any industry since 2010. Tech’s share of total leasing activity by square footage rose to 21% in 2021 from 12% in 2010 before economic headwinds lowered it to 16% in H1 2022.
Growth and occupancy dynamics have evolved since the start of the pandemic, causing many office space occupiers to reassess their portfolio needs. Some companies have decided to reduce their office footprints by subleasing excess space or not fully renewing leases on expiration. While these cost-cutting measures were not isolated to the tech industry, they were more pronounced in certain tech-oriented markets where high levels of pre-pandemic leasing activity had occurred.
Figure 9: Tech-30 Aggregate Available Office Sublease Space
Source: CBRE Research, Q2 2022..
Available sublease space in Tech-30 markets began rising in 2020 amid reduced tenant demand. Surplus office space more than doubled to a historical high of 142 million sq. ft. between Q4 2019 and Q2 2022 (Figure 9). The rise in available sublease space varies considerably by market and is directly associated with the concentration of tech companies that serve weakened economic sectors and that choose remote-first or hybrid work arrangements.
Tech companies currently account for 20% of available sublease space across Tech-30 markets, down from 23% in 2021. Potential risk in these markets stems from tech companies that have either leased more space than they currently need or are downsizing due to job cuts or permanent shifts to fully remote or hybrid working. About 45% of tech industry sublease space in Tech-30 markets is scheduled to expire and be returned to property owners by 2025.
Sublease concentration and saturation are key variables that influence the potential risk that sublease availability poses to office market fundamentals. The “Sublease Risk Radar” (Figure 10) plots sublease space growth and tech concentration against the saturation of sublease availability. The overall risk across Tech-30 markets is medium-high, with a 3.8% sublease availability rate of total inventory. Markets with a high concentration of tech, rising sublease space inventory and a high sublease availability rate—those in the upper right quadrant of the radar—have a medium to high level of risk that sublease space will weaken market fundamentals.
Figure 10: Sublease Risk Radar - Tech Office Markets
Note: Sublease Risk Radar measures the relative risk of tech sublease dispositions across top markets with available data, Sublease Growth/Tech Concentration is a function of sublease inventory growth over the past year and the concentration of disposed tech subleases during Q2 2022. Sublease Availability is the portion of total market inventory available for sublease. The quadrant lines represent the aggregate average for each measure.
Source: CBRE Research, Q2 2022.
San Francisco is at the highest position on the risk spectrum with an 8.8% sublease availability rate, down from 10.6% in Q2 2021. Silicon Valley has surpassed San Francisco as the market with the highest growth and concentration of sublease availability from tech companies, although sublease availability remains below average and there’s still demand for quality sublease spaces. Other markets with higher-than-average risk—those with above-average growth in the amount of sublease availability over the past year—include Raleigh-Durham, Salt Lake City, Phoenix and Nashville.
Market cycle positioning
Real estate cycles influence investment and occupancy decisions. Markets generally move across four cycle phases at varying degrees, with some remaining in one cyclical phase for an extended period. Most Tech-30 markets remained in the contraction phase of the office market cycle in Q2 2022, characterized by weakened demand, rising supply and falling rents (Figure 11). Some markets did not contract significantly, while others entered the stabilization and growth phases, including Vancouver, Boston, Raleigh-Durham, Silicon Valley and San Diego.
Figure 11: Tech-30 Office Market Cycle
Source: CBRE Research, Q2 2022.
Most Tech-30 markets remained in the contraction phase of the office market cycle in Q2 2022 and may move to the stable phase over the next 12 months, characterized by increasing demand and modest changes in supply and rents.
Tech industry indicators
Given the tech industry’s impact on the U.S. economy and real estate demand, monitoring the industry’s most reliable indicators is important. CBRE finds that financial market trends are the most accurate indicators of the tech industry’s growth prospects.
Capital availability has historically been a harbinger of growth for the tech industry. At the early stages of tech company growth, venture capital funding is the key indicator of business formation. Thus, the availability and flow of venture capital fuels business and employment growth for private tech companies. Capital flowing into venture funds and to venture-backed companies has been very high in recent years.
According to CB Insights, venture capital funding in the U.S. has been increasing since 2010 (Figure 12). The pandemic caused venture capital funding to surge, initially to shore up finances for companies that still had strong long-term growth prospects and then for those poised to benefit from pandemic-induced trends such as remote working, e-commerce and digitalization technologies. This led to record-high funding of $276 billion in 2021. Through August 2022, $136 billion of venture capital funding has been allocated. Full-year 2022 funding is on pace to exceed $180 billion—below last year’s historic high-water mark but $48 billion more than in 2020.
Figure 12: U.S. Venture Capital Funding
Source: CBRE Research, Q2 2022.
Share prices also are a good barometer of growth prospects for publicly traded tech companies. Because most tech companies are listed on the Nasdaq stock exchange, the Nasdaq Index has become a reliable indicator of business and employment activity. Analysis of high-tech employment patterns suggests that the Nasdaq Index acts as a 12-month leading indicator of employment levels at a 93% correlation (Figure 13). The extraordinary rise of the Nasdaq after hitting its low in March 2020 was based on future earnings potential and pandemic-related growth for many tech companies. By 2022, these growth prospects dimmed and the Nasdaq sold off significantly. This suggests high-tech industry job growth will at least slow and possibly decline if stock valuations come under additional pressure.
Figure 13: Nasdaq vs. Tech Employment
Source: Nasdaq, U.S. Bureau of Labor Statistics and CBRE Research, August 2022.

The Shiller S&P 500 Cyclically Adjusted Price-to-Earnings Ratio (CAPE), which measures the broader equity market valuation, continued to increase last year and reached 39 by August 2021 (Figure 14). That indicated potentially stretched stock valuations, as occurred just before the Global Financial Crisis in 2008 and the dot-com bubble bust in 2000. Those concerns have proved to be correct as the S&P 500 index and the CAPE have significantly declined this year.
Figure 14: Shiller S&P 500 Cyclically Adjusted Price-to-Earnings Ratio (CAPE RATIO)
Source: Shiller PE Ratio, August 2022.
Tech companies will remain major users of office space and likely will add more jobs once economic conditions improve by the second half of 2023. The tech industry’s growth leadership will endure and continue to generate significant office demand, benefiting many of the Tech-30 markets in the years ahead.

Next 10 Markets to Watch
Figure 15: The Next 10 Tech Markets to Watch
Notes: *Waterloo, Ottawa and Calgary rents in C$. Bubble size is based on concentration of office employment.
Source: U.S. Bureau of Labor Statistics, Statistics Canada, CBRE Research, Q2 2022.
Related Insights
CBRE Global Research experts share their views on what’s in store for the global economy, office, industrial, retail, multifamily and capital markets for 2022 and beyond.
- Brief | Intelligent Investment
Tech Insights: Tech Office Leasing Flattens in H1 2022
August 24, 2022 2 Minute Read
Economic uncertainty and low space usage contributed to a negligible 1% year-over-year increase in tech office leasing volume in H1 2022.
Related Services
- Industries
Tech, Communications & Entertainment
We provide proactive real estate solutions for technology, media and telecommunication companies at every stage.
- Services
Invest, Finance & Value
Get specialized advice and find investment opportunities to fuel your future.
- Services
Plan, Lease and Occupy
Drive value and growth with consulting and transaction services that align with your strategic goals.
- Manage Properties and Portfolios
Property Management
Maximize property performance with innovative management solutions, cutting-edge technology and unique amenities.


