Intelligent Investment
U.S. Senior Housing & Care Investor Survey H2 2025
December 18, 2025 5 Minute Read
About Our Survey
This 17th edition of CBRE’s Senior Housing & Care Investor Survey, conducted in late October 2025, polled the same group of senior housing real estate professionals and investors as our last survey in April and had a 98% response rate.
A clear majority of respondents indicated either no change or a decrease in capitalization rates since the April survey, and more than 84% said they expect cap rates to compress over the next 12 months.
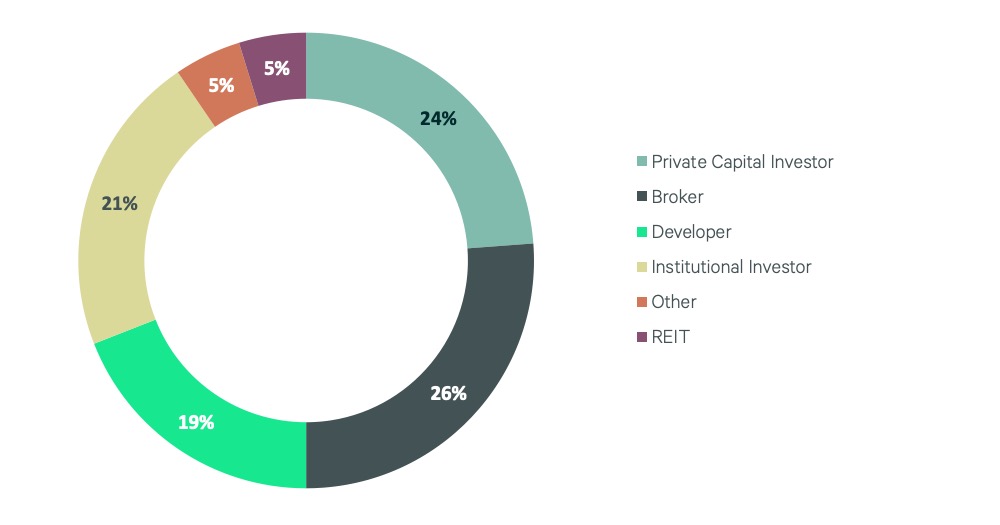
Figure 1: Survey Respondent Categories (%)
Senior Housing Trends
- Sixty-seven percent of respondents said senior housing cap rates decreased since the April survey.
- On average, senior housing cap rates fell by 17 basis points (bps) over the past six months.
- Skilled Nursing (SN) cap rates decreased by 14 bps between April and October, after decreasing by 10 bps over the previous six months.
- The average cap rate for Independent Living (IL) communities decreased by 20 bps between April and October, making it the segment with the largest decline from the prior survey.
- Active Adult (AA) and Assisted Living (AL) cap rates fell by 18 and 19 bps, respectively. After 48 consecutive months of increases, Memory Care (MC) cap rates decreased by 16 bps on average from the prior survey.
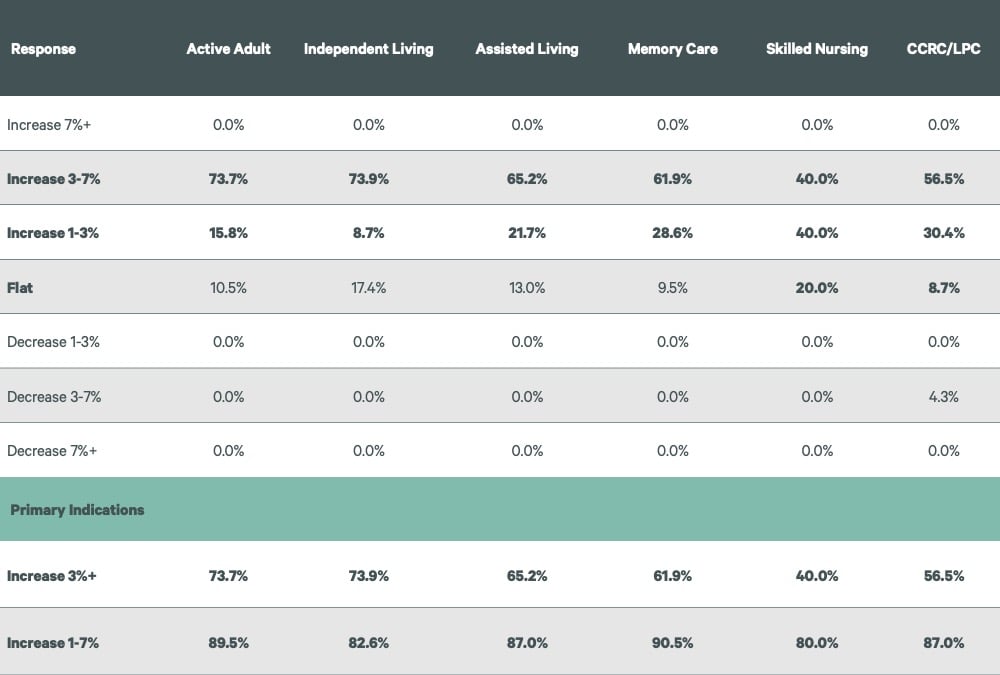
- For AA, IL, AL and MC communities, 69% of survey respondents said they expect rental rate increases of between 3% to 7% over the next 12 months, up from 57% in the prior survey.
- No respondents reported underwriting rent growth above 7% for the second consecutive survey, compared with the 12% of respondents who did so in the April 2024 survey.

Investor Survey Results
Within core markets, the average cap rate for Class A Independent Living and Active Adult communities fell the most, down by 25 bps each to 6.1% and 5.5%, respectively.
Figure 2: Senior Housing & Care Capitalization Rates

Figure 3: Capitalization Rate Change from Prior Survey

Cap rate spreads between asset classes were essentially unchanged at +3 bps.
The average spread between core and non-core assets increased by 3 bps to 56 bps.
Figure 4: Senior Housing & Care Capitalization Rate Spreads; Investment Class & Location

Figure 5a: Senior Housing & Care — Historical Capitalization Rate Trends
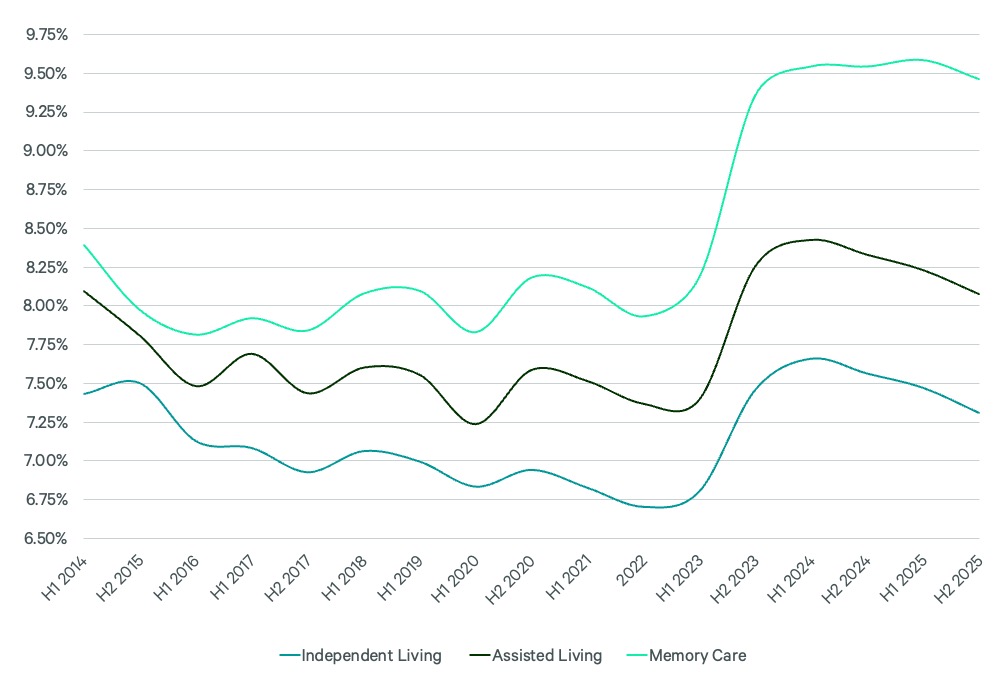
Source: CBRE Senior Housing Investor Survey results, H2 2025.
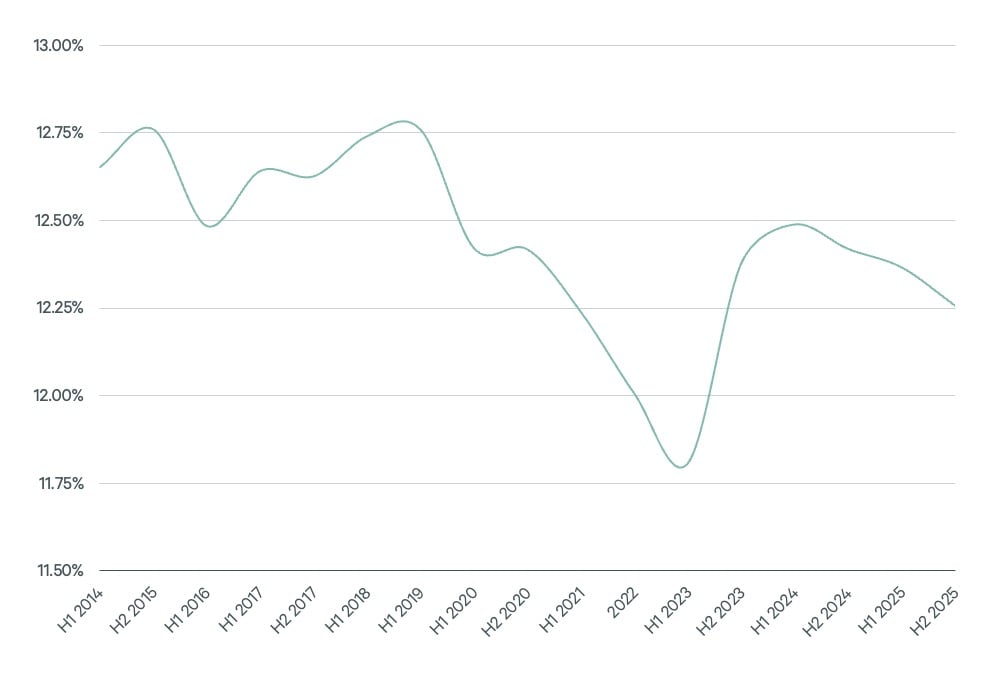
Figure 5b: Active Adult

Source: CBRE Senior Housing Investor Survey results, H2 2025.
Figure 5c: Skilled Nursing
Source: CBRE Senior Housing Investor Survey results, H2 2025.
Figure 5d: CCRC/LPC

Source: CBRE Senior Housing Investor Survey results, H2 2025.
Rent Growth Expectations
A larger majority of survey respondents expect rent growth of between 3% to 7% over the next 12 months than in the prior survey. No respondents reported underwriting rent growth above 7%, continuing a trend that was evident in the prior two surveys.
CBRE forecasts annual rent growth of more than 5% over the next 36 months. Rental rates that make new development feasible remain approximately 15% to 20% above market rent in most core markets, but this gap is expected to continue contracting in 2026.
The sector will need to add more than 200,000 units by 2028 to accommodate rising demand from an aging population, according to senior housing data provider NIC MAP. Only 20,034 units were under construction as of Q3 2025, down from 21,750 units in Q1 2025.
Top-quality Independent Living communities delivered between 2018 and 2021 stand to benefit the most, as any new construction will likely offer fewer amenities and lower-quality interior finishes due to rising costs.
Figure 6: 2026 Rent Growth Expectations
Capitalization Rate Expectations
Five out of six respondents expect senior housing cap rates to decrease over the next 12 months, while only 16% expect no change. No respondents expect cap rates to increase in 2026.
Figure 7: What is Your 12-Month Outlook for Senior Housing Cap Rates?

Related Insights
-

This 16th edition of CBRE’s Senior Housing & Care Investor Survey, conducted in late April 2025.
-
Report | Intelligent Investment
U.S. Seniors Housing & Care Investor Survey H2 2024
November 27, 2024

This 15th edition of CBRE’s Senior Housing & Care Investor Survey, conducted in October 2024, polled the same group of senior housing real estate professionals and investors as our last survey in April and had a 96% response rate.

Senior Housing
Research
Valuation & Advisory Services
Daniel Lincoln, MAI
VAS Executive Vice President

Andy Kepchar, MAI
VAS Executive Vice President