Intelligent Investment
U.S. Office Leasing Activity Slows in March but Tenant Interest Grows
CBRE Pulse of U.S. Office Demand
April 20, 2022 5 Minute Read
Read the full report and data for all 12 markets
Tenant requirements climbed to a pandemic-era high in March, but the rise in search activity wasn't enough to improve CBRE's Pulse of U.S. Office Demand tracker. Leasing activity slowed for the fifth straight month as occupiers continued to delay long-term commitments due to lingering concerns over COVID infections and uncertainty spurred by inflation and geopolitical events. However, the rise in tenant requirements suggests there is pent-up demand for office space, which should support an improvement in U.S. office demand later this year.
What is the CBRE Pulse Report?
To gauge the pace of recovery, CBRE has created three indices for the 12 largest U.S. office markets—Atlanta, Boston, Chicago, Dallas/Fort Worth, Denver, Houston, Los Angeles, Manhattan, Philadelphia, San Francisco, Seattle and Washington, D.C.
Using CBRE data, these indices measure office market activity each month and provide early indications of when and where momentum in office demand may be shifting.
These metrics—space requirements of active tenants in the market (TIM), leasing activity and sublease availability—provide a clear picture of office demand amid the COVID-19 pandemic.
March Findings
The U.S. Tenants in the Market (TIM) Index increased by 2 points to a pandemic-era high of 91 in March. The index serves as an early indicator of leasing activity later in the year. Eight markets had TIM Index levels that either increased or were unchanged from February. Four markets had TIM index levels that exceeded their pre-pandemic levels: Houston (130), Boston (127), Dallas/Fort Worth (110) and Manhattan (105). Two other markets—Denver (94) and Seattle (92)—were near their pre-pandemic levels.
The U.S. Leasing Activity Index slowed in March as occupiers exercised caution due to lingering concerns over COVID infections. The index fell by 15 points month-over-month to a level of 72—the biggest monthly decline since CBRE began the Pulse tracker in March 2020. Despite this setback, the index is 15 points above its level of a year ago.
Leasing Index levels of 10 of the 12 markets tracked by CBRE fell in March. The biggest declines occurred in Seattle (-43 points), Denver (-31 points) and Los Angeles (-30 points). Despite the decline, Los Angeles’s index level is still near its pre-pandemic baseline at 99—the second-highest level of all 12 markets tracked by CBRE. Manhattan and Houston were the only markets with increased Leasing Index levels in March at 68 and 58, respectively.
The U.S. Sublease Availability Index increased by 3 points in March to a level of 199. The index has been volatile from month to month but has remained within a 10-point range since August 2021, which is stalling the U.S. office market recovery. Six of the 12 markets recorded an increase in their sublease inventories in March, while three declined and three were unchanged.
Notes: All market data is for the metropolitan area except for San Francisco, which only includes the downtown market, and for Manhattan. Prior months data has been revised from previous reports to reflect new information. Data presented in this report supersedes that of previous editions of the Pulse of U.S. Office Demand.
U.S. Average Performance Index
Figure 1: Indexed Average Performance of Sublease Availability, TIM and Leasing Activity for the Top 12 U.S. Markets
Source: CBRE Research, March 2022.
March Demand Recovery by Market
Boston, Dallas/Fort Worth and Los Angeles remained the leaders for office demand recovery in March. Manhattan followed, advancing in its recovery from an increase in tenant requirements and leasing activity. Sustained occupier caution was apparent in Atlanta, Washington, D.C. and Chicago, where progress toward recovery has stalled. However, the recovery is expected to resume as more occupiers encourage a return to the office and COVID cases decline.
Figure 2: March Office Market Recovery Scale, Top U.S. Markets
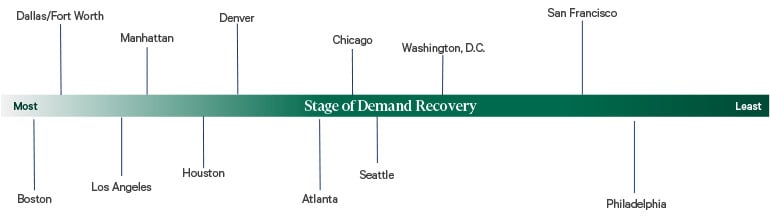
Source: CBRE Research, March 2022.
Tenants in the Market Index
Figure 3: Indexed Square Footage of Tenant Requirements Compared with 2018/2019 Average
Source: CBRE Research, March 2022.
The U.S. Tenants in the Market (TIM) Index increased by 2 points to a level of 91 in March, its highest point since the start of the pandemic. This increase indicates that leasing activity levels should improve in coming months.
Four markets—Houston (130), Boston (127), Dallas/Fort Worth (110) and Manhattan (105)—were above their pre-pandemic TIM Index levels, while two markets—Denver (94) and Seattle (92)—were near their pre-pandemic levels.
TIM Index levels increased or were unchanged in eight markets, with Boston (+9 points) and Los Angeles (+7 points) posting the largest month-over-month increases. TIM levels have steadily increased for three consecutive months in Los Angeles (74) and San Francisco (73), though both are still more than 25 points below their pre-pandemic levels. Washington, D.C.’s index level has been steadily falling since December and stood at 63 in March—the second lowest of all 12 markets tracked by CBRE.
Figure 4: March 2022 TIM Index–Top 12 U.S. Markets
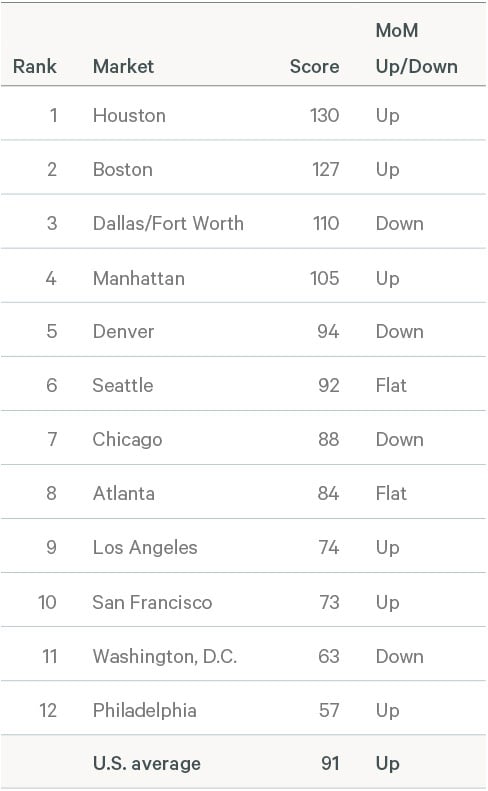
Source: CBRE Research, March 2022.
TIM Index methodology note: CBRE tracks the total square footage of requirements from active tenants in the market, with minimum requirements of 10,000 sq. ft. The TIM Index compares the total monthly TIM requirements to a pre-pandemic baseline, which is the average of TIM requirements recorded by CBRE in 2018 and 2019. The index level for the baseline is 100. In most cases, when tenant requirements are given as a range, the index uses the minimum square footage., However, Seattle records TIM using the average requirement within the tenants' size range, while Philadelphia uses the maximum square footage.
Leasing Activity Index
Figure 5: Indexed Monthly Leasing by Market Compared with 2018/2019 Average
Source: CBRE Research, March 2022.
The U.S. Leasing Activity Index fell by 15 points to a level of 72 in March, continuing its monthly decline since the omicron variant emerged in November 2021. The March slowdown was widespread, with leasing index levels down in 10 of the 12 markets tracked by CBRE. Manhattan (+11 points) and Houston (+6 points) were the only markets with increased leasing activity in March.
Several markets have seen a sustained slowdown in leasing activity, with Atlanta (79), Washington, D.C. (64) and Chicago (45) recording five consecutive months of decline.
Seattle, Denver and Los Angeles had the steepest month-over-month declines in their Leasing Activity Index levels. Seattle (54) and Denver (75) fell by 43 and 31 points, respectively, after being near or above their pre-pandemic levels just a few months earlier. Los Angeles (99) also recorded a notable decline of 29 points in March but remained near its pre-pandemic level.
Figure 6: March 2022 Leasing Activity Index –Top 12 U.S. Markets

Source: CBRE Research, March 2022.
Leasing Index methodology note: Leasing activity includes all new leases, expansions and renewals of 10,000 sq. ft. or more that close each month. The Leasing Activity Index uses a rolling three-month average of leasing activity. Most markets the weighted 20% for the current month, 50% for the previous month and 30% for two months prior. For New York and Boston, where more accurate leasing data is available by the end of each month, the weights are 50% for the current month, 30% for the previous month and 20% for two months prior. The monthly rolling average is compared with a pre-pandemic baseline, which is the average monthly leasing activity between 2018 and 2019. The index level for the baseline is 100.
Sublease Availability Index
Figure 7: Indexed Sublease Availability by Market Compared with 2018/2019 Average
Source: CBRE Research, March 2022.
The U.S. Sublease Availability Index increased by 3 points in March to 199. While the index remains stubbornly high, it is down from its peak of 206 in June 2021. Sublease availability has essentially remained unchanged from August 2021.
Six of the 12 markets recorded an increase in their sublease inventory in March. The largest gains were in markets that rank among the highest for sublease space—Seattle (250), Philadelphia (240) and Atlanta (198).
In Seattle, the increase was due to several small and large tenants offloading unused office space, while in Philadelphia and Atlanta only a few large occupiers gave back space during the month.
The substantial sublease supply in these markets will slow their recovery. Despite a monthly uptick in its sublease index, Houston (91) is the only market with sublease availability below the pre-pandemic level.
Three markets recorded a decrease in their sublease indices: Boston (138), Dallas/Fort Worth (149) and San Francisco (451). The index was unchanged in Los Angeles (172), Chicago (178) and Manhattan (190).
Sublease Index methodology note: Sublease availability measures the total square footage of sublease space available for occupancy. The Sublease Availability Index compares monthly sublease availability totals with a pre-pandemic baseline, which is the average amount of sublease space available in 2018 and 2019. The index level for the baseline is 100.
Note: In contrast to the Leasing and TIM Indices, a higher score on the Sublease Index is considered undesirable as it reflects an increase in available sublease space.
Figure 8: March 2022 Sublease Availability Index –Top 12 U.S. Markets
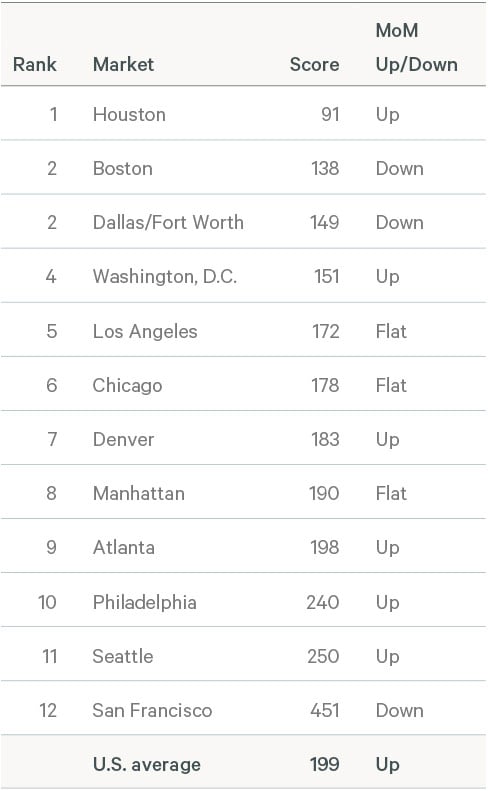
Source: CBRE Research, March 2022.
Office Demand Expected to Regain Momentum
The slowdown in office demand persisted in March and will likely continue over the next few months. However, the recent rise in tenant requirements provides some optimism that the recovery will gain momentum later this year. The improved public health situation and the current push among occupiers to welcome employees back to the office will likely support future leasing activity. However, the glut of sublease space will continue to weigh on the office market.
Related Insights
The CBRE Pulse of U.S. Office Demand slowed for a second consecutive month in February.
- Brief | Intelligent Investment
Omicron Impact on U.S. Office Demand Persists in January
February 17, 2022 5 Minute Read
The CBRE Pulse of U.S. Office Demand slowed in January, as occupiers paused on leasing activity in the face of the omicron surge.
- Brief | Intelligent Investment
Omicron Surge Slows U.S. Office Demand in December
January 26, 2022 5 Minute Read
The CBRE Pulse of U.S. Office Demand slowed moderately in December, likely reflecting renewed occupier caution over the COVID-19 omicron surge.
- Brief | Intelligent Investment
U.S. Office Demand Stable in November Despite COVID Concerns
December 20, 2021 5 Minute Read
The CBRE Pulse of U.S. Office Demand showed little change in November.
