Future Cities
2023 North America Industrial Big Box Review & Outlook: Louisville
April 4, 2023 5 Minute Read

Louisville is an ideal location for multiple corporate sectors due to its attractive labor supply, location and presence of UPS Worldport. Kentucky’s status as a global auto manufacturing powerhouse is important. There is over $8.4 billion committed to electric vehicle investments and multi-billion-dollar investments in existing plants. Louisville’s strong fundamentals continue to make it a marquis location for big-box development.
Demographics
Nearly 30 million people—24% aged 18-34—live within 250 miles of downtown Louisville, with a 1% projected five-year growth rate. Louisville has a larger population concentration within a 250-mile radius than other major industrial markets, including the Inland Empire, DFW, Phoenix, Memphis and Atlanta.
Figure 1: Louisville Population Analysis

Source: CBRE Location Intelligence, Q4 2022.
The local warehouse labor force is 41,111 with an expected growth rate of 4.6% by 2032, according to CBRE Labor Analytics. The average salary for non-supervisory warehouse workers is $17.11 per hour, 1.2% over the national average.
Figure 2: Louisville Warehouse & Storage Labor Fundamentals

Source: CBRE Labor Analytics, Q4 2022.
*Median wage (1 year experience); non-supervisory warehouse material handlers.
Location Incentives
Over the past five years, there have been 252 publicly known economic incentives deals totaling over $336 million for an average of $14,399 per new job in metro Louisville, according to Wavteq.
CBRE’s Location Incentives Group reports that top incentive programs offered in Louisville include the Kentucky Business Investment Program (KBI), offering income tax credits and wage assessments to businesses engaged in manufacturing, agribusiness, headquarter operations, alternative fuel, renewable energy or carbon dioxide transmission pipelines. To qualify, companies must create and maintain an annual average of at least 10 new full-time jobs for Kentucky residents during the length of the incentive agreement.
Another popular incentive program is the Kentucky Enterprise Initiative Act (KEIA), offering companies a sales and use tax refund for building and construction materials used to improve real property value. This refund is also available for research and development, data processing and flight simulation equipment.
Figure 3: Louisville Top Incentive Programs
Source: CBRE Location Incentives Group, Q4 2022.
Note: The extent, if any, of state and local incentive offerings depends on location and scope of the operation.
Logistics Driver
Louisville Muhammad Ali International Airport was named the world’s fourth-busiest air cargo hub by Airport Councils International. The airport is home to UPS Worldport, one of the world’s largest package-handling facilities. The region also hosts a growing manufacturing base, particularly medical, packaging materials and automotive. This is driving demand for surrounding distribution centers. As e-commerce’s share of total retail sales keeps growing, more distributors are expected to take advantage of the region’s air cargo capabilities.

Louisville Muhammad Ali International Airport is home to UPS Worldport, one of the world's largest package-handling facilities.
Capital Markets
Louisville is one of the most targeted secondary markets for institutional capital, and the area benefits from UPS as a global demand driver and transportation hub. Cap rates for Class A stabilized properties expanded to the low 5% range. But CBRE projects Louisville’s strong investment and operating performance will keep attracting capital for existing projects and speculative development opportunities.
Supply & Demand
Louisville’s central location is attracting new occupiers, leading to robust demand and new development. Louisville’s transaction volume could not keep up with 2021’s record-breaking year, finishing at 5.2 million sq. ft. It had 3.6 million sq. ft. of positive net absorption. 3PLs dominated leasing, followed by e-commerce, and automobiles, tires and parts. Louisville’s record-low vacancy rate in 2021 led to a significant increase in development, with completions reaching a record 7.5 million sq. ft. The much-needed new development increased vacancy rates to a healthy 3.9%.
At year-end, 6.4 million sq. ft. was under construction, one of the few markets with less under-construction volume than completions. 30.2% of under-construction space is pre-leased. Louisville will become of the few under-supplied North American emerging markets, despite temporary space gains, due to low inventory under construction and a projected drop in construction starts. This will lead to significant rent growth in the coming quarters.
Figure 4: Share of 2022 Leasing by Occupier Type

Note: Includes new leases and renewals 200,000 sq. ft. and above.
Source: CBRE Research, 2022.
Figure 5: Lease Transaction Volume by Size Range

Note: Includes new leases and renewals 200,000 sq. ft. and above.
Source: CBRE Research, 2022.
Figure 6: 2022 Construction Completions vs. Overall Net Absorption by Size Range
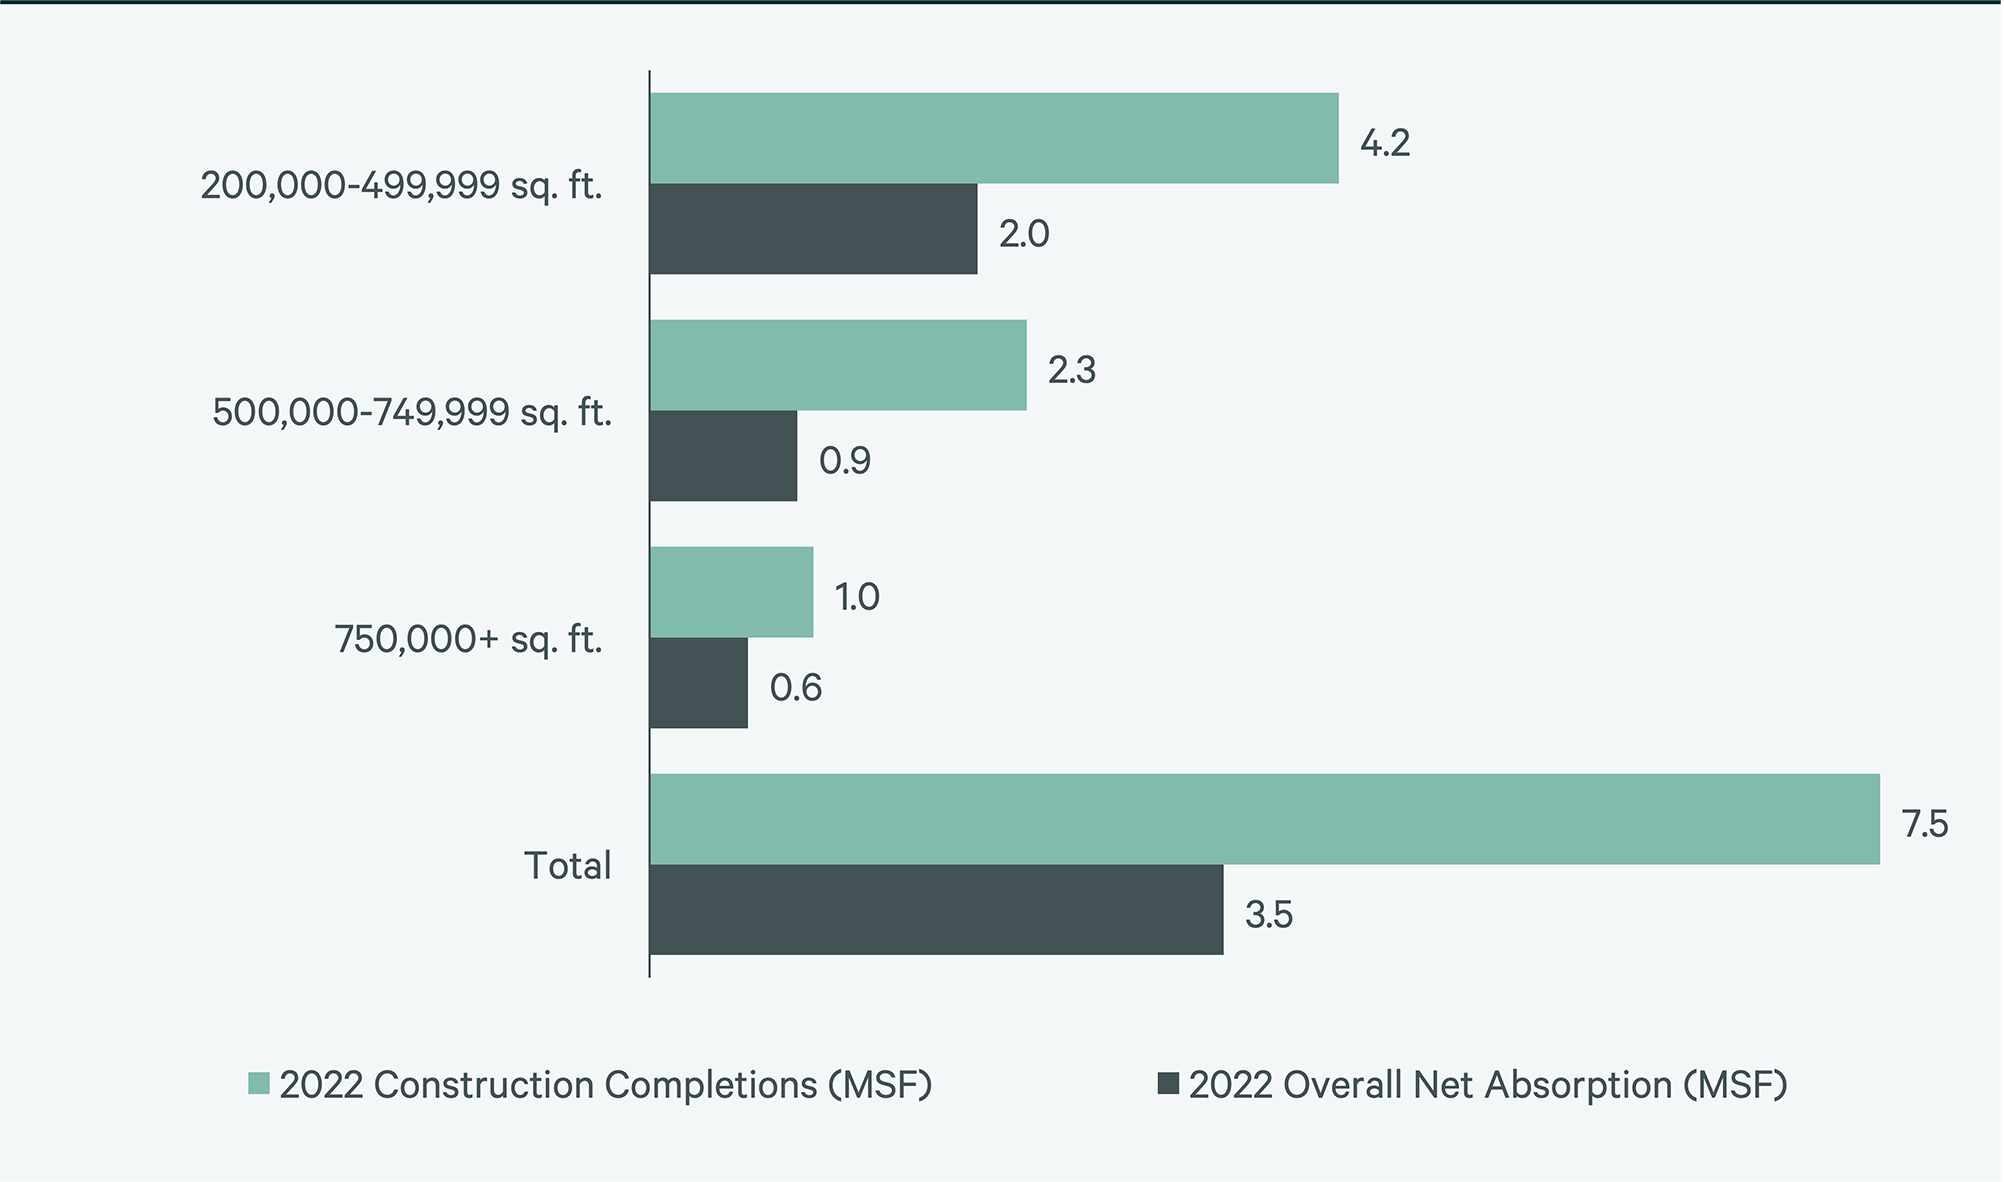
Source: CBRE Research, 2022.
Figure 7: Direct Vacancy Rate by Size Range

Source: CBRE Research, 2022.
Figure 8: Under Construction & Percentage Preleased
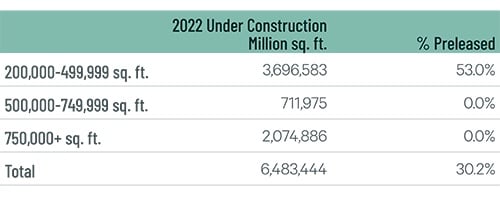
Source: CBRE Research, 2022.
Figure 9: First Year Taking Rents (psf/yr)
Note: Includes first year taking rents for leases 200,000 sq. ft. and above.
Source: CBRE Research, 2022.
Explore Big Box Insights by Market

Cincinnati’s central location makes it ideal for big-box occupiers. Over 2.8 million people live within 50 miles of the market core.

More than 2.6 million people live within 50 miles of the market core, with a projected five-year growth rate of 2.1%.

Over 2.6 million people live within a 50-mile radius of the urban core, with a 2.3% expected five-year growth rate.


