Future Cities
2023 North America Industrial Big Box Review & Outlook: Northern/Central New Jersey
April 4, 2023 5 Minute Read

Northern/Central New Jersey continues to lead the nation with the most active seaport on the East Coast. As economic conditions are stressed throughout the region, the New Jersey industrial market remains resilient. A lack of new supply, restricted land availability, and rising interest rates continue to drive low vacancy and rising rents. Big-box demand is still growing but becoming more balanced with supply. As market rents start easing from rapid growth, owners are prioritizing occupiers with strong balance sheets and long-term needs.
Demographics
The Northern/Central New Jersey market serves the largest population in the U.S. within 50-, 100- and 250-mile radius areas. While the population within 50 miles of the core is projected to decline by 0.9% over five years, it will remain the largest. Warehouse occupancy demand will continue.
Figure 1: Northern/Central New Jersey Population Analysis

Source: CBRE Location Intelligence, Q4 2022.
The region has 215,914 warehouse workers—the most in North America, according to CBRE Labor Analytics. This workforce is expected to grow by 4.7% by 2032. Because of robust labor demand, the average non-supervisory warehouse worker wage is $19.80 per hour—17% above the national average.
Figure 2: Northern/Central New Jersey Warehouse & Storage Labor Fundamentals

Source: CBRE Labor Analytics, Q4 2022.
*Median wage (1 year experience); non-supervisory warehouse material handlers.
Location Incentives
CBRE’s Location Incentives Group reports New Jersey state enacted legislation under the Economic Recovery Act of 2020 that replaces the Grow NJ program. Grow NJ sunsets March 1, 2027. This program provides state corporate income tax credits for new and retained jobs for up to seven years under the following conditions:
- Tax credits can be used, sold or transferred for at least 85%of value. A business may sell the credits for 90% of value to the New Jersey Treasury, rather than to a third party.
- Legislation now requires a letter of support from the subject municipality and a public hearing for approval.
- Among additional program requirements, target industries must create at least 25 net new full-time jobs, and non-targeted industries must create at least 35 net new full-time jobs. Projects in qualified areas must retain 500+ full-time jobs, and projects in non-qualified areas must retain 1,000+ full-time jobs.
- At least $60 per square foot must be spent on new construction, while at least $20 per square foot must be spent on existing warehousing, logistics, industrial or R&D facilities.
Local municipalities may offer further tax abatement and tax increment financing for selected specialized projects.
Figure 3: Northern/Central New Jersey Top Incentive Programs
Source: CBRE Location Incentives Group, Q4 2022.
Note: The extent, if any, of state and local incentive offerings depends on location and scope of the operation.
Logistics Driver
The Port Authority of New York and New Jersey is the East Coast’s busiest and second most-active seaport in the U.S., with infrastructure to move cargo by air, land, rail and sea. The port had a strong 2022 with total TEU volume increasing 5.6%, as many importers shifted cargo to diversify sourcing and avoid delays at the Southern California ports. The port has direct access to over 28 million consumers.
Five airports have direct cargo lines to the port, including John F. Kennedy, Newark Liberty, LaGuardia, New York Stewart and Teterboro. Numerous bridges and tunnels near the port provide access to the tri-state area and beyond.

The Port Authority of New York and New Jersey is the East Coast’s busiest and second most-active seaport in the U.S., with infrastructure to move cargo by air, land, rail and sea.
Capital Markets
Regardless of recent macroeconomic concerns, investor demand and market fundamentals in Northern/Central New Jersey remains very strong. Low vacancy rates and 30% year-over-year rental rate growth have counterbalanced the increasing cost of capital. Extremely low supply of functional Class A and B space and severe barriers to entry for new development will keep consistent upward pressure on rental rates and annual escalations. Although pricing has waned from its H1 2022 peak, CBRE projects it will rise through 2023.
Supply & Demand
Northern/Central New Jersey is the fourth-largest North American industrial market, with 368 million sq. ft. of total inventory. There was nearly 19 million sq. ft. of transactions in 2022, below 2021’s record pace but 36% above 2020. Developers completed over 9 million sq. ft. of new facilities in 2022, increasing the direct vacancy rate to 2.4%. There is currently nearly 10 million sq. ft. under construction, with 22% pre-leased.
Robust transaction volume and low vacancy rates drove up first-year base rents by 36.2% through 2022, to a record $14.99 PSF per year. 3PLs were the year’s most active sector, accounting for over half 2022 leasing. CBRE projects demand will remain strong through 2023, given the shift of imports to the East Coast and the market’s large population.
Figure 4: Share of 2022 Leasing by Occupier Type
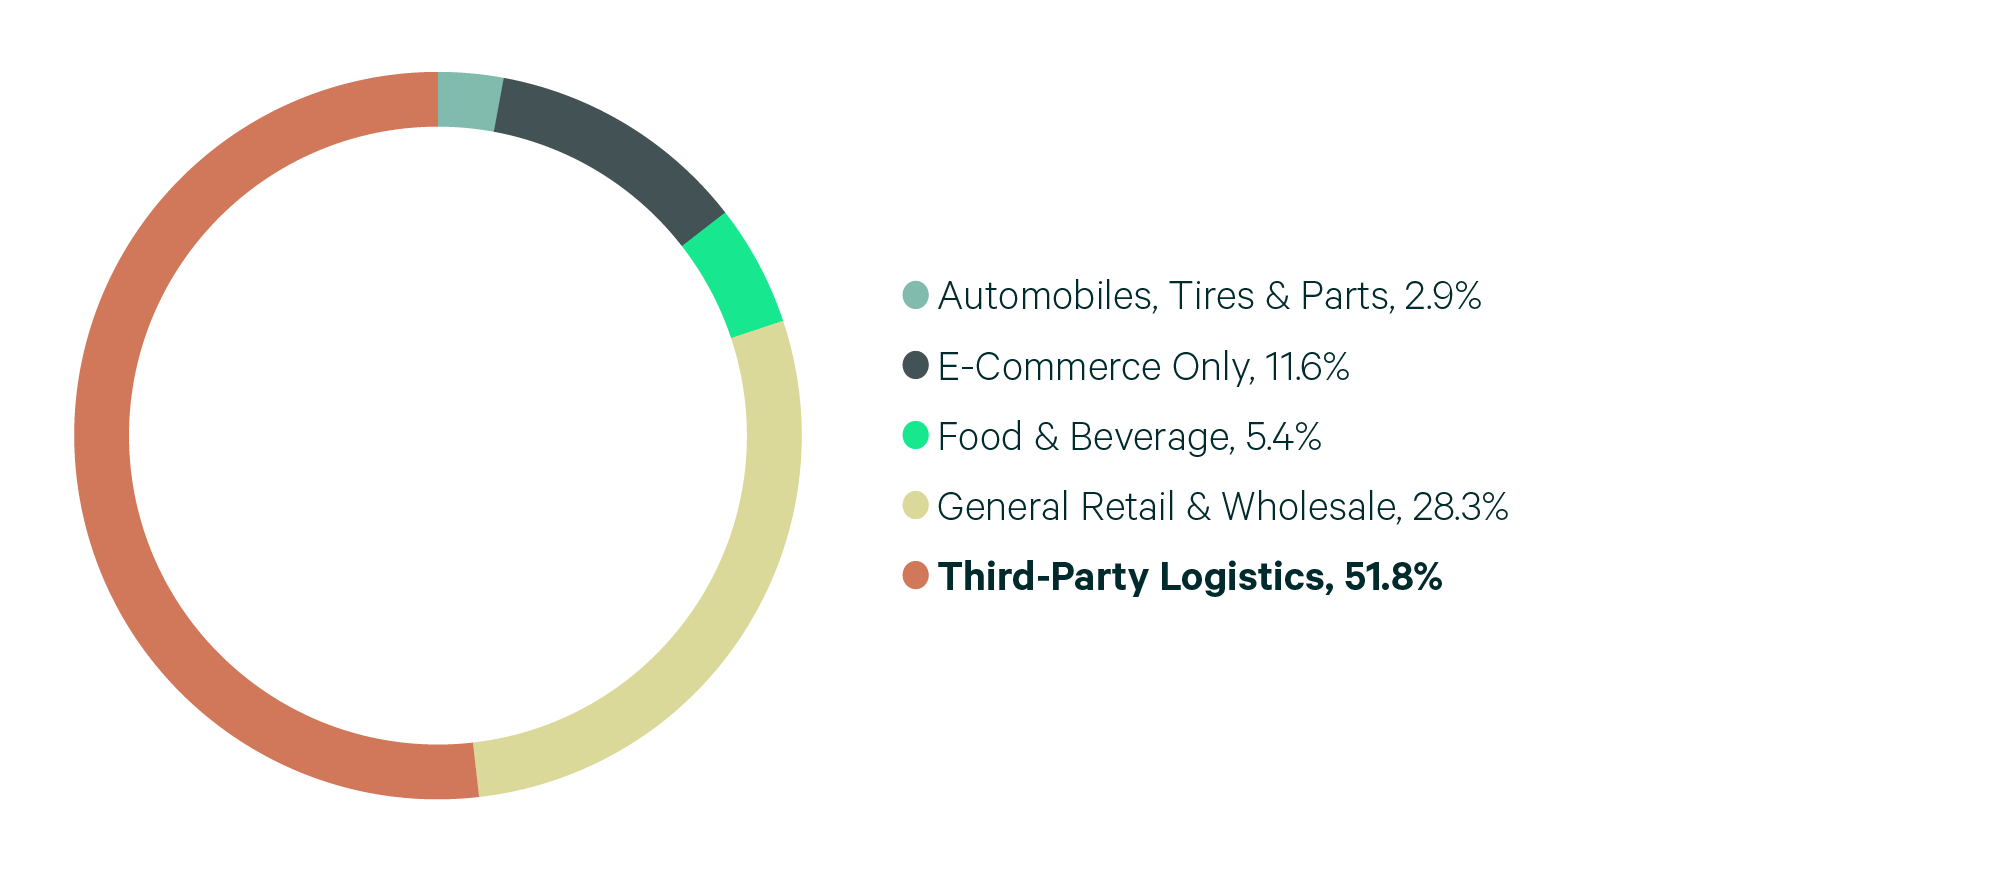
Note: Includes new leases and renewals 200,000 sq. ft. and above.
Source: CBRE Research, 2022.
Figure 5: Lease Transaction Volume by Size Range
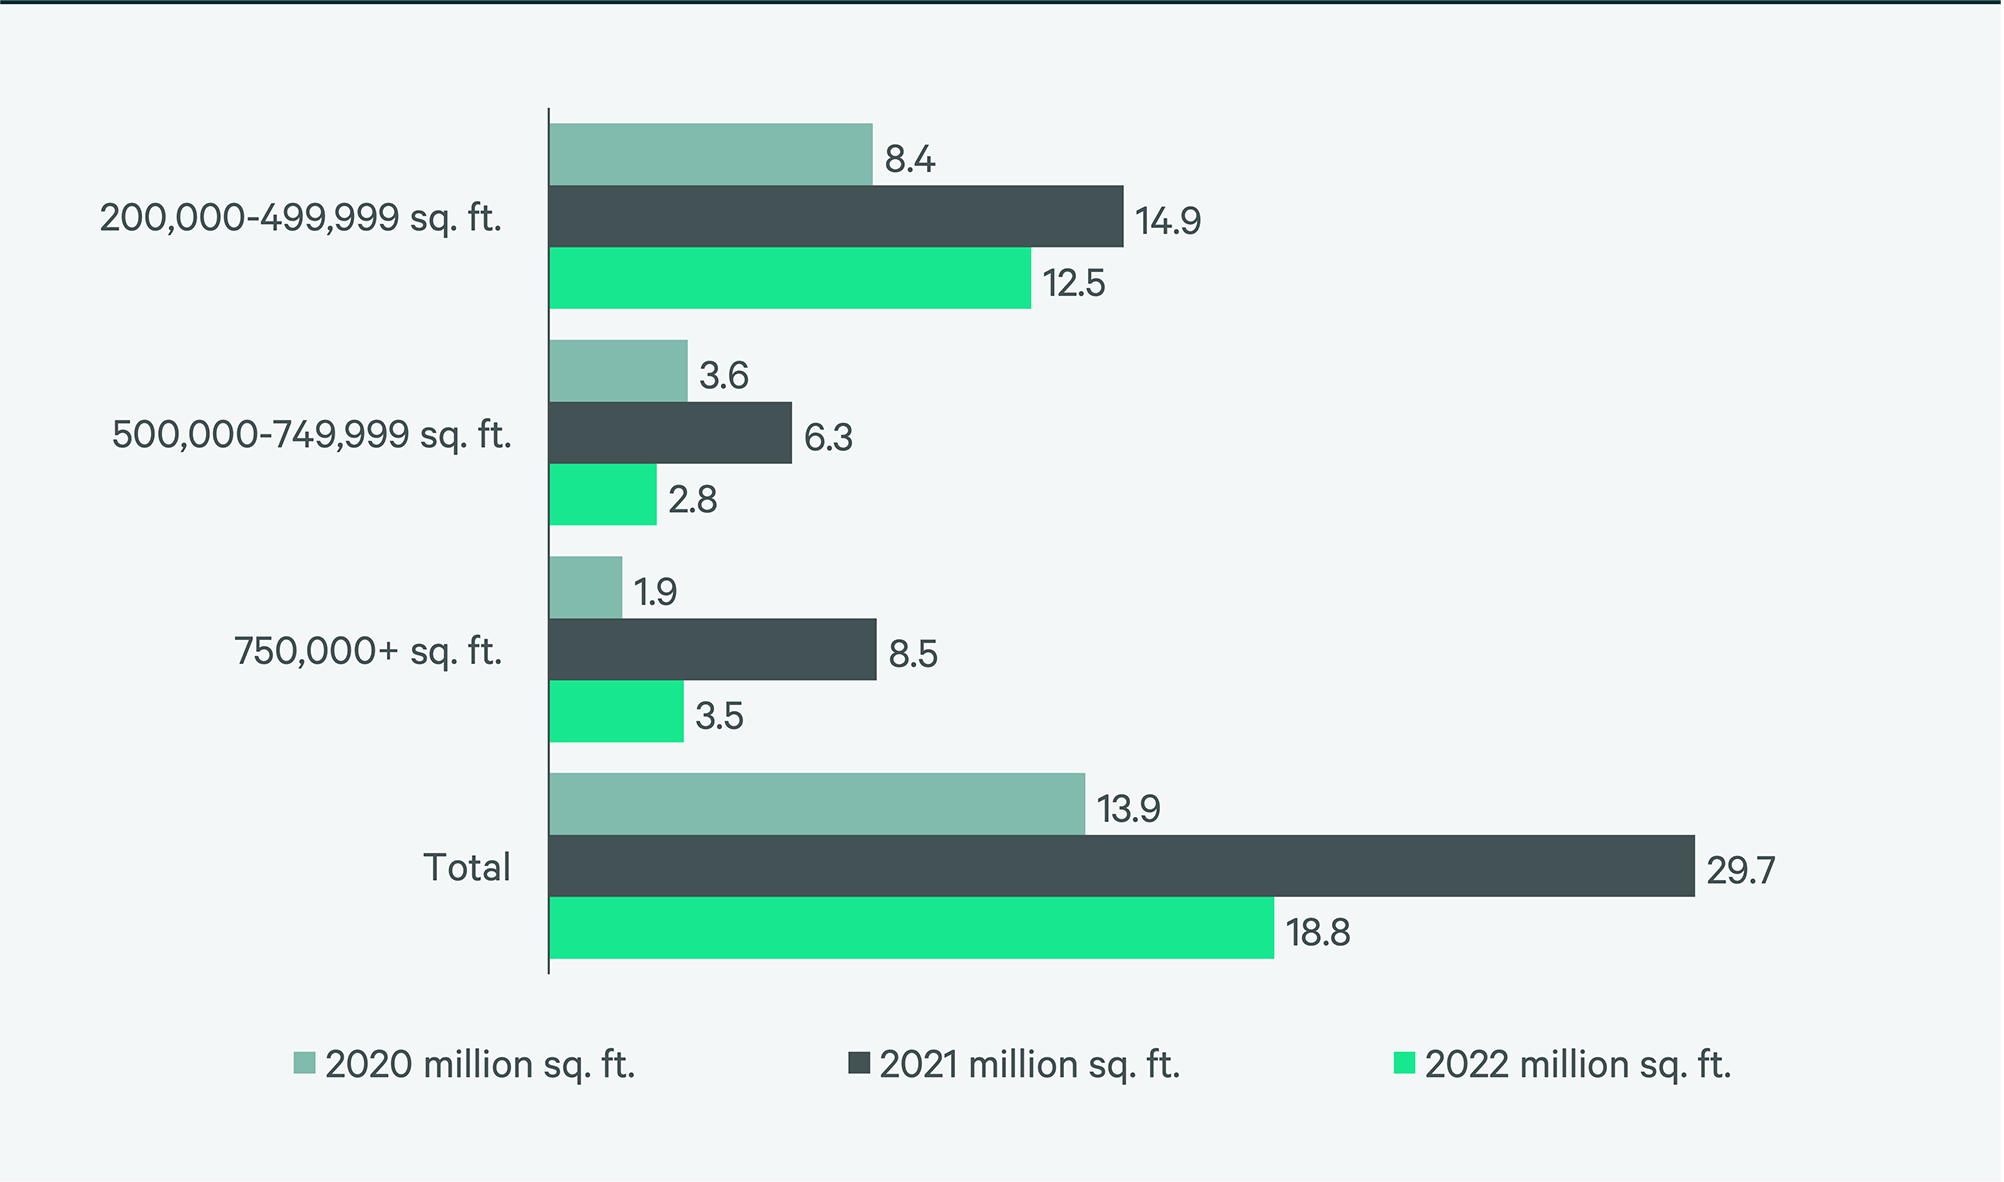
Note: Includes new leases and renewals 200,000 sq. ft. and above.
Source: CBRE Research, 2022.
Figure 6: 2022 Construction Completions vs. Overall Net Absorption by Size Range
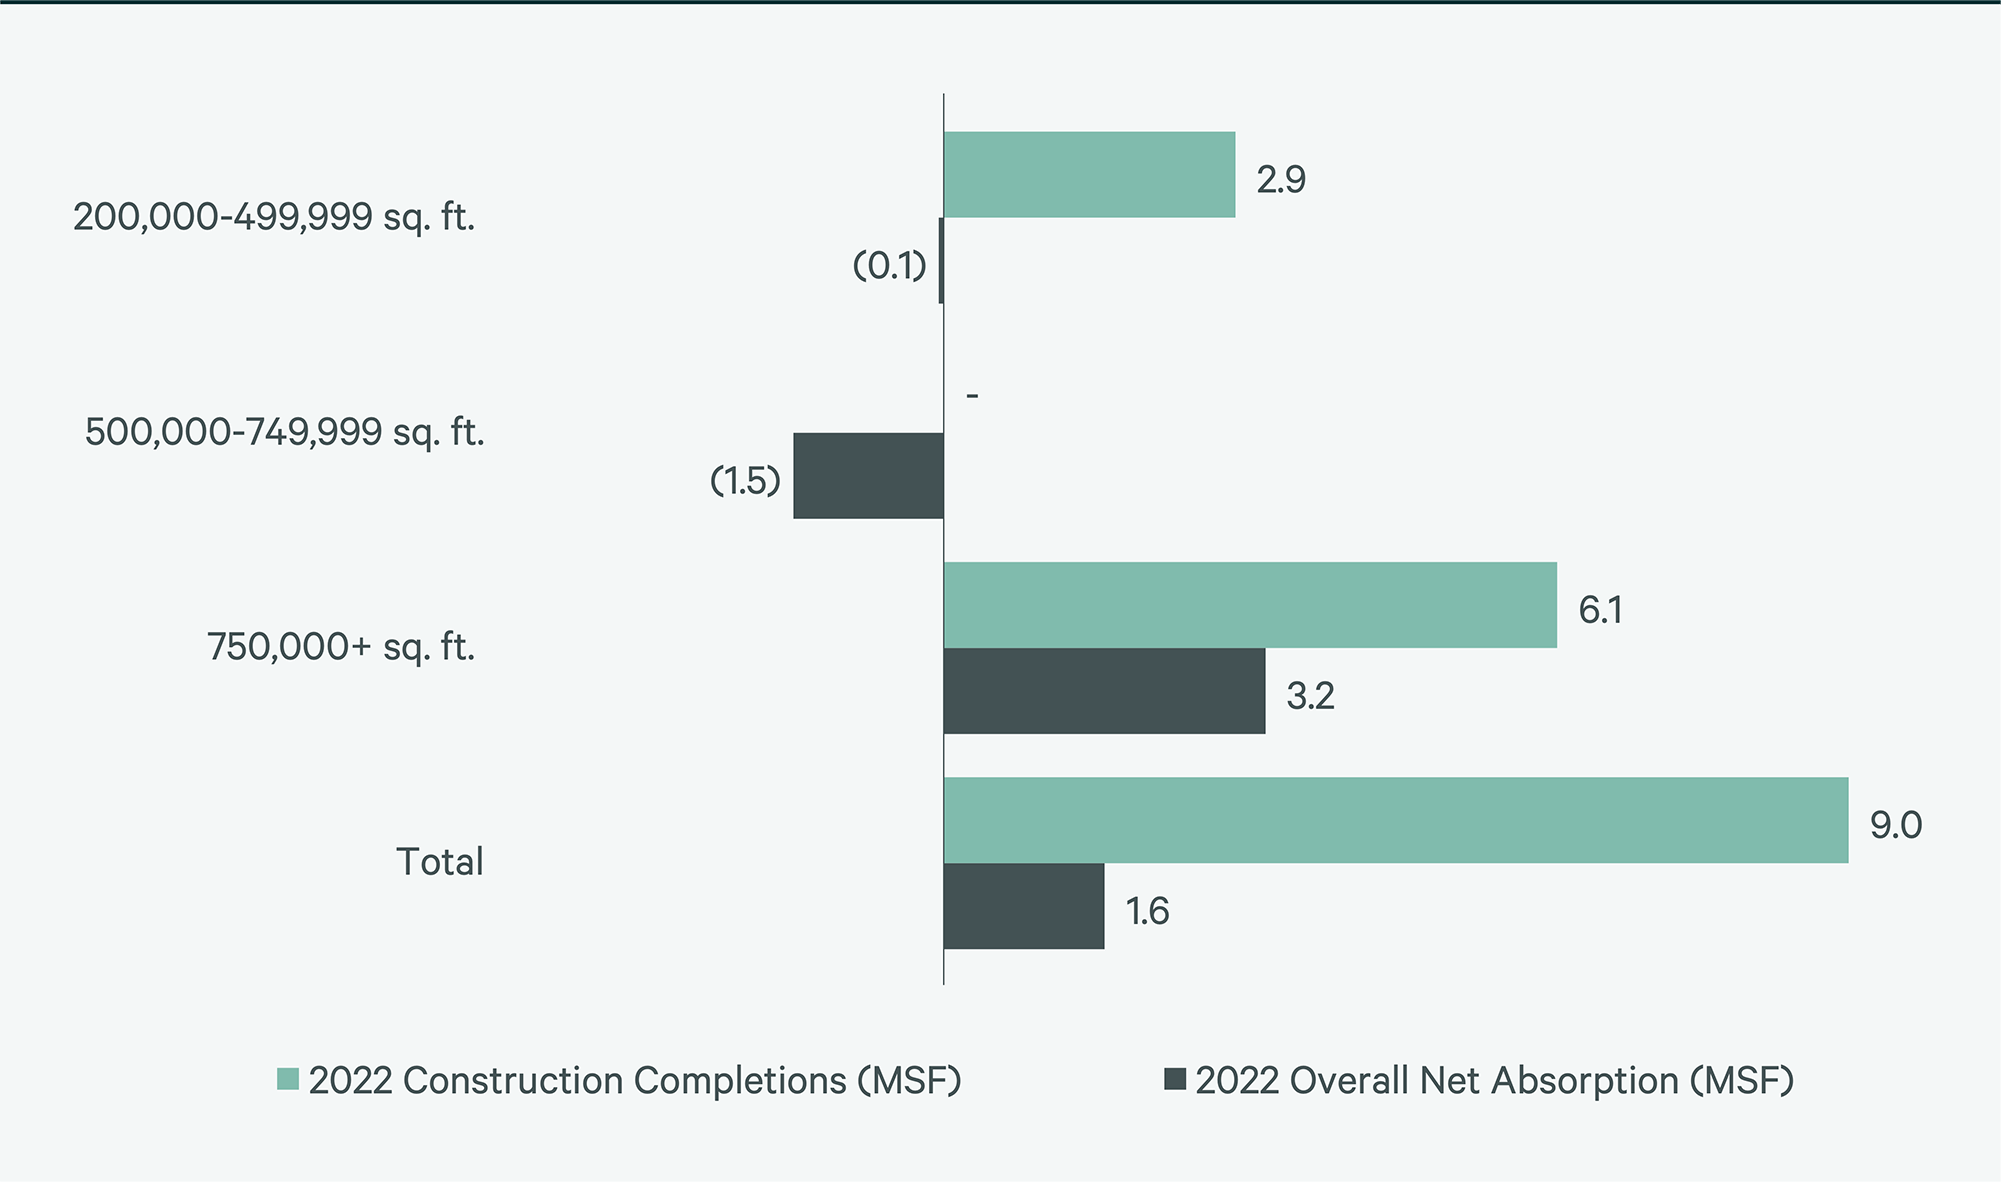
Source: CBRE Research, 2022.
Figure 7: Direct Vacancy Rate by Size Range

Source: CBRE Research, 2022.
Figure 8: Under Construction & Percentage Preleased
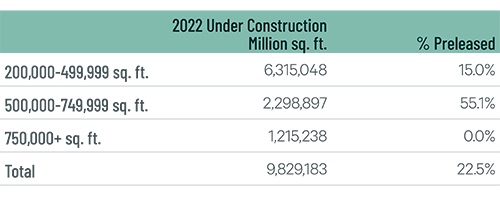
Source: CBRE Research, 2022.
Figure 9: First Year Taking Rents (psf/yr)
Note: Includes first year taking rents for leases 200,000 sq. ft. and above.
Source: CBRE Research, 2022.
Explore Big Box Insights by Market

More than 18 million people—23% aged 18-34—live within 100 miles of downtown Baltimore, with a 1.0% projected five-year growth rate.

Over 8 million people live within 50 miles of the market core, and 60 million are within 250-miles.

More than 8.7 million people live within 50 miles of the market core, the highest population concentration in Canada.
Contacts
John Morris
Group President, Leasing, Advisory Services


