Intelligent Investment
Build-to-Rent Residential Market Overview
Evolving Renter Preferences Create New Investment Opportunities
October 16, 2024 13 Minute Read

Executive Summary
This report provides an overview of the U.S. Build-to-Rent (BTR) residential sector and answers the following questions:
- What is BTR?
- What does a typical BTR property look like?
- Who owns BTR assets and how do they perform?
- How do BTR properties compare with traditional multifamily properties?
BTR residential development is helping to alleviate the nation’s housing shortage. BTR properties have all the characteristics of single-family homes but are built for renters who want features not typically offered by multifamily properties.
Most BTR communities consist of 50 or more homes or townhomes that operate similarly to multifamily properties. However, unlike apartment buildings, BTR homes do not have any units attached above or below them. BTR communities generally are owned by groups of investors and are professionally managed, often with shared amenities and an on-site leasing office.
BTR is a subsector of the broader Single-Family Rental (SFR) market, which includes scattered homes for rent that are mostly owned by individual investors.
BTR is a particularly attractive option for millennials, who are reaching the prime age for major life milestones like child-rearing but can’t afford homeownership. BTR also is an appealing option for empty nesters who want the financial flexibility and lifestyle ease of renting versus owning. Both cohorts are driving strong demand for large BTR developments.
Favorable fundamentals and scaling of the BTR market over the past five years have attracted many institutional investors to the sector.

Introduction to Build-to-Rent (BTR)
Definition, Characteristics & Demand Drivers
Broad Characteristics of BTR

Professional Property Management
High-quality, for-rent, single-family homes or townhomes owned by a single entity and professionally managed. Property managers handle leasing, landscaping, repairs and maintenance for the entire community.
Property Features
BTR homes offer privacy without other residents living in units that are attached above or below them. Building products are generally durable and low maintenance, such as high-quality faux wood floors and hard-surface countertops. Unit sizes are much bigger than traditional multifamily units and most include exclusive outdoor space. First-floor ceilings are typically nine feet high with windows on all walls, given that many of these properties are detached. In contrast, apartment ceilings are often eight feet high with windows on only one wall due to shared corridors.
Transit-Oriented
Convenient access to major highways and public transportation are often critical features of competitive BTR communities.
Neighborhood Feel
Low density homes with yards and additional greenspaces like parks are an attractive aspect of BTR communities to young families and empty nesters.
Community Amenities
Many BTR communities offer amenities like walking trails, green spaces and dog parks, while some also offer more attractive amenities like swimming pools, clubhouses and gated access.
Detailed Characteristics of BTR
Style
- Mostly detached single-family homes.
- Attached designs are included when they have single-family like characteristics (e.g., front entry from street, garage, driveway, dedicated yards, limited shared walls and no units attached above or below them).
Outdoor Space
- Yard and/or patio.
- Shared outdoor spaces such as walking trails and dog parks.
Parking
- Dedicated parking garage attached to home with driveway.
- Some attached units exclude dedicated parking.
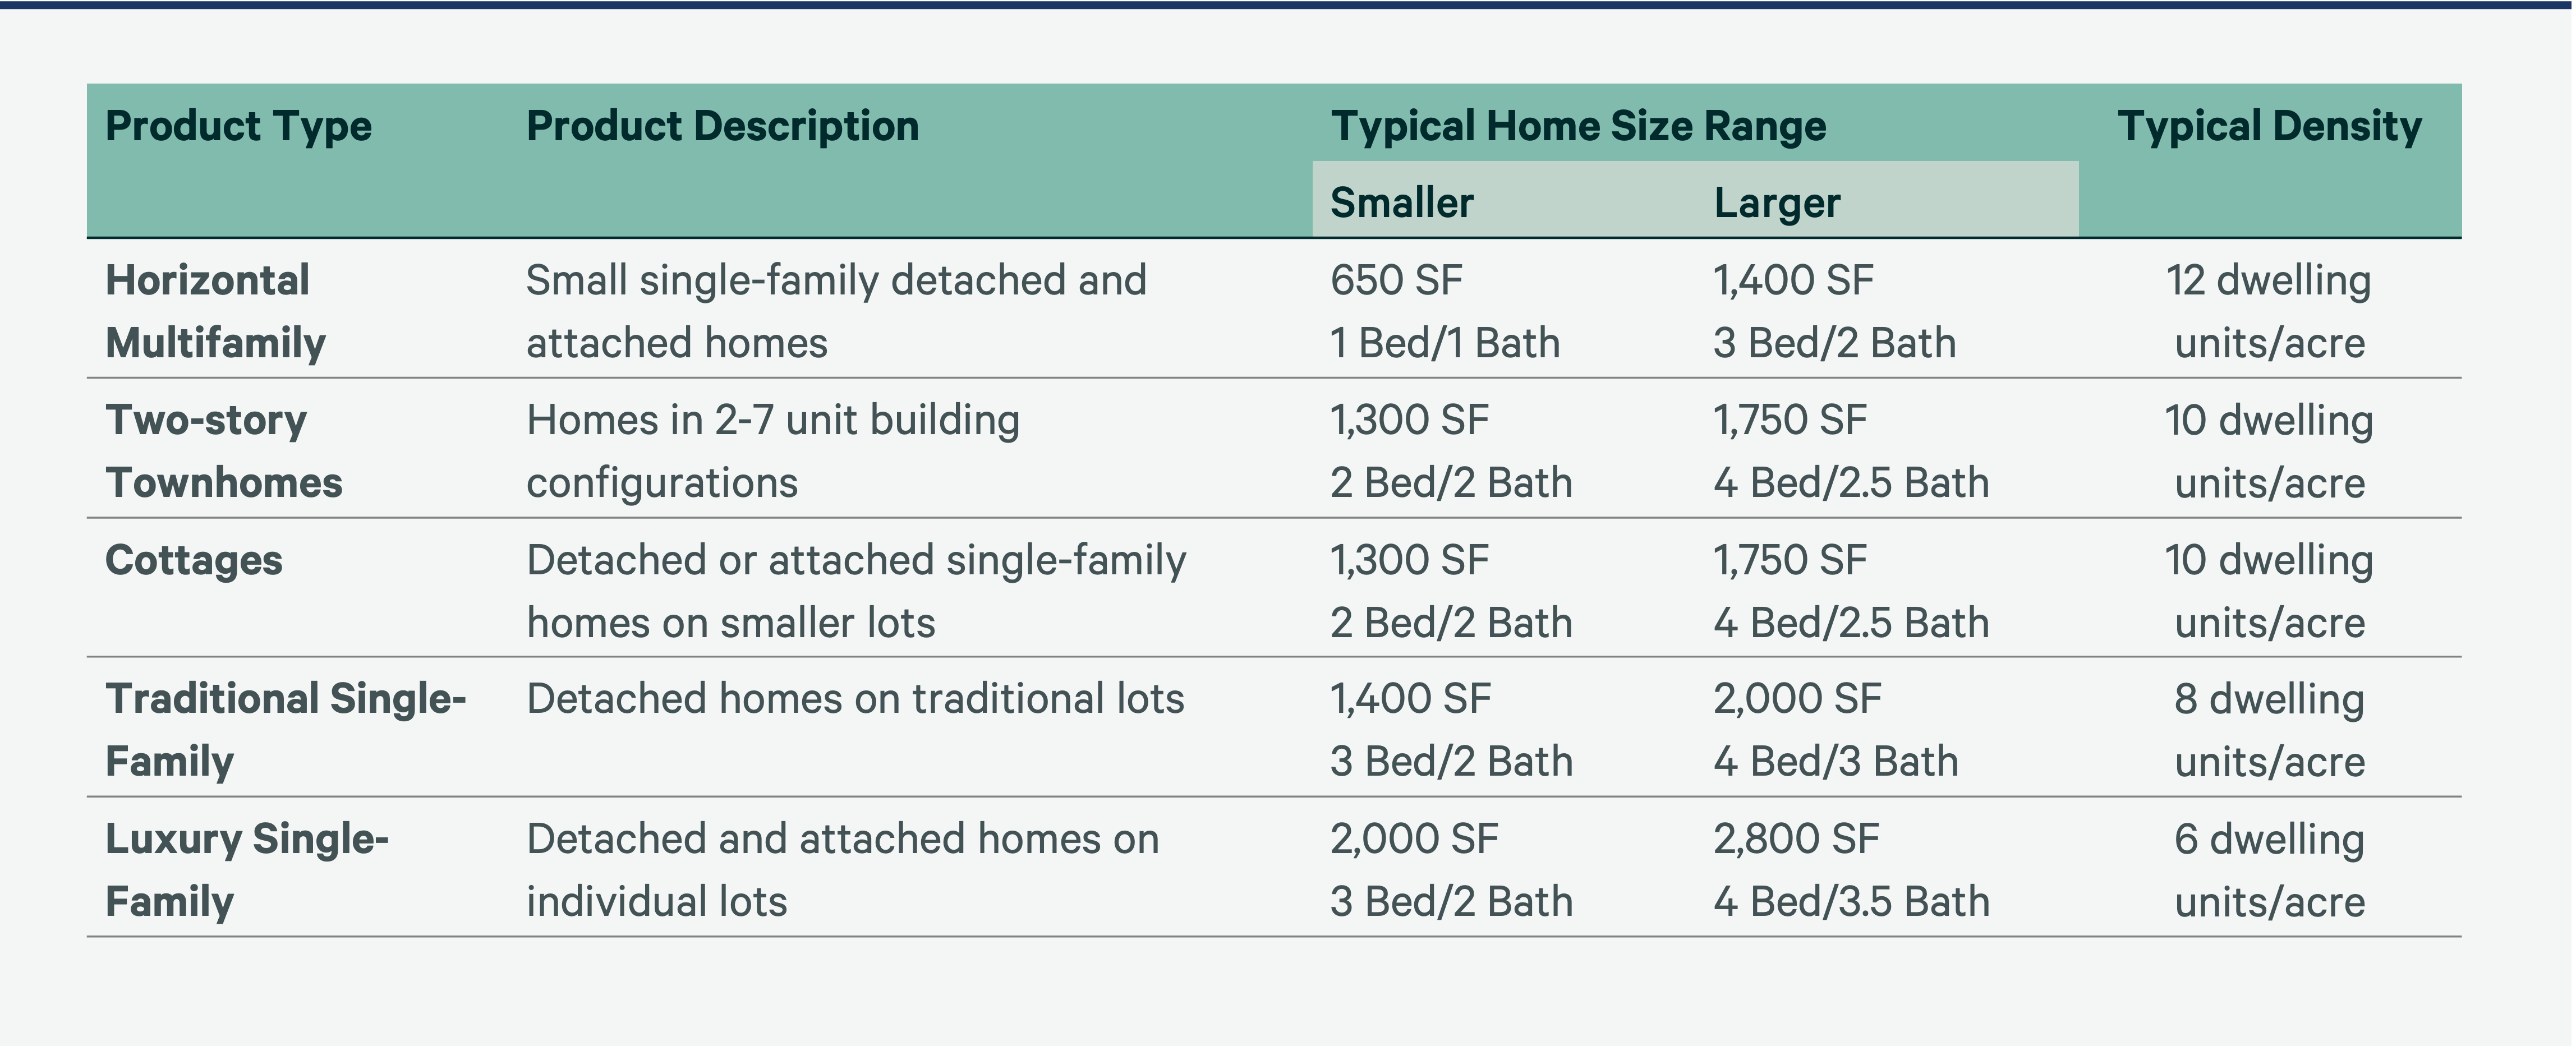
Density
- Typically six to 12 units per acre.
- BTR is generally lower-density than traditional multifamily but varies greatly by style and location.
Location
- Typically less dense suburban or exurban locations within one-hour commute of urban centers.
- Some BTR developments are located in infill locations and/or within a master-planned community.
Community Amenities
- Walking trails, green spaces, dog parks; sometimes swimming pools, community centers, fitness centers and playgrounds.
- Some communities have no amenities.
- Rental housing residents may have access to shared amenities if part of a master-planned community that also has for-sale housing.
Management & Leasing
- Professionally managed.
- On-site leasing office.
- Some smaller properties do not have on-site leasing; companies with multifamily experience are common.
Age
- The BTR sector is relatively new, with one-quarter of properties built in the past three years.
Bedrooms
- Horizontal multifamily units are relatively small, with one to three bedrooms.
- Single-family detached and townhome properties typically have two to four bedrooms.
Square Footage
- Horizontal multifamily units have an average size of 1,160 sq. ft.1 based on unit mixes and floor plans, similar to traditional multifamily units.
- Single-family detached and townhome BTR properties range between 1,500 and 2,000 sq. ft.
Lawn/Landscaping
- Performed by management and usually with some charge-back to residents.
- Differs from scattered SFR properties, renters of which usually are responsible for lawn care and landscaping.
Parcel
- Homes may be individually platted or all on a common plat.
- Communities with individually platted homes often provide renters with a unique address.
1 Source: CBRE Research, Yardi Matrix, Q1 2023.
BTR Sub-Categories

Horizontal multifamily communities are similar to traditional vertical multifamily properties in terms of unit sizes, types and amenities, but don’t stack units on top of each other.

Typically, the largest homes of the three subcategories, often with three or more bedrooms.

Vary in scale, density and orientation, but typically provide attached garages and larger unit sizes than horizontal multifamily communities.
BTR Product Groupings
Figure 1
BTR vs. Scattered SFR
Understanding the difference between BTR and Scattered-Site Single-Family Rental (SFR) properties is important, given institutional investors' focus on a variety of residential investment opportunities.
BTR differs from Scattered-Site SFR in design, amenities, management, location and typical vintage.
Figure 2

BTR Demand Drivers
RENTER Demand Drivers
INVESTOR Demand Drivers
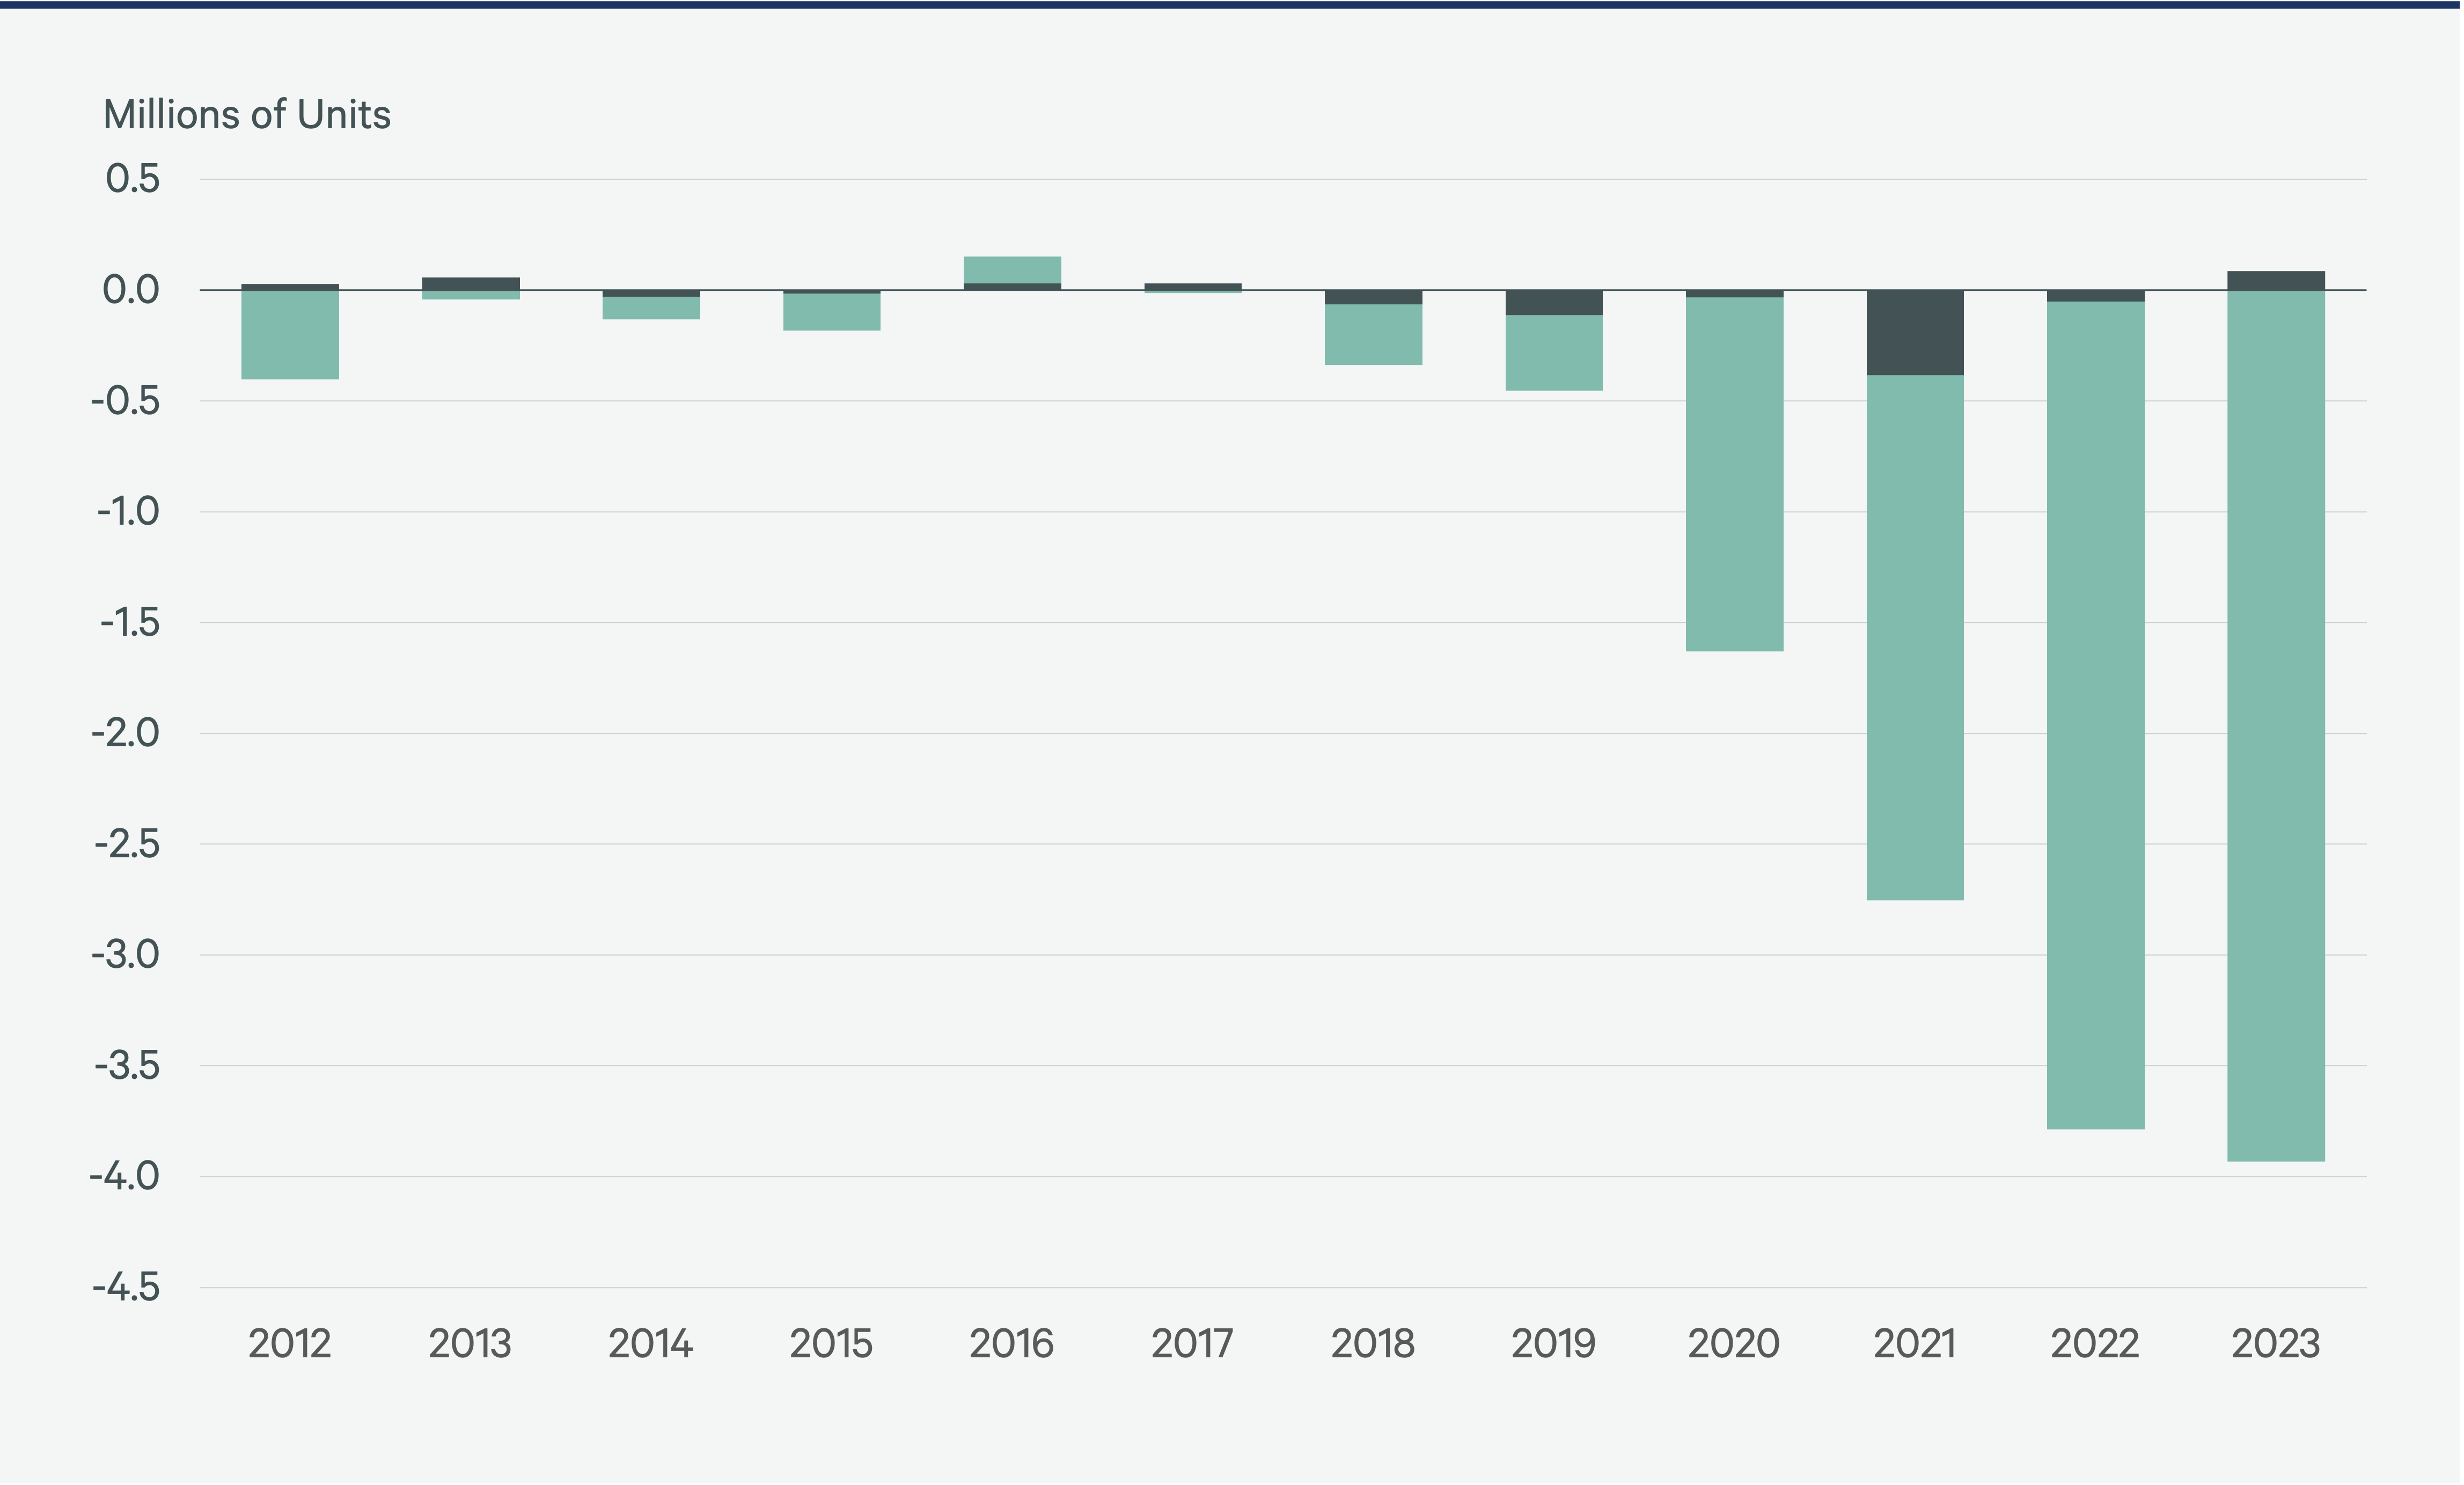
U.S. Housing Surplus/Shortage
The U.S. has an estimated shortage of 3.9 million housing units. Multifamily vacancy is only slightly above its long-run average, suggesting the shortage is entirely single-family properties.
Figure 3
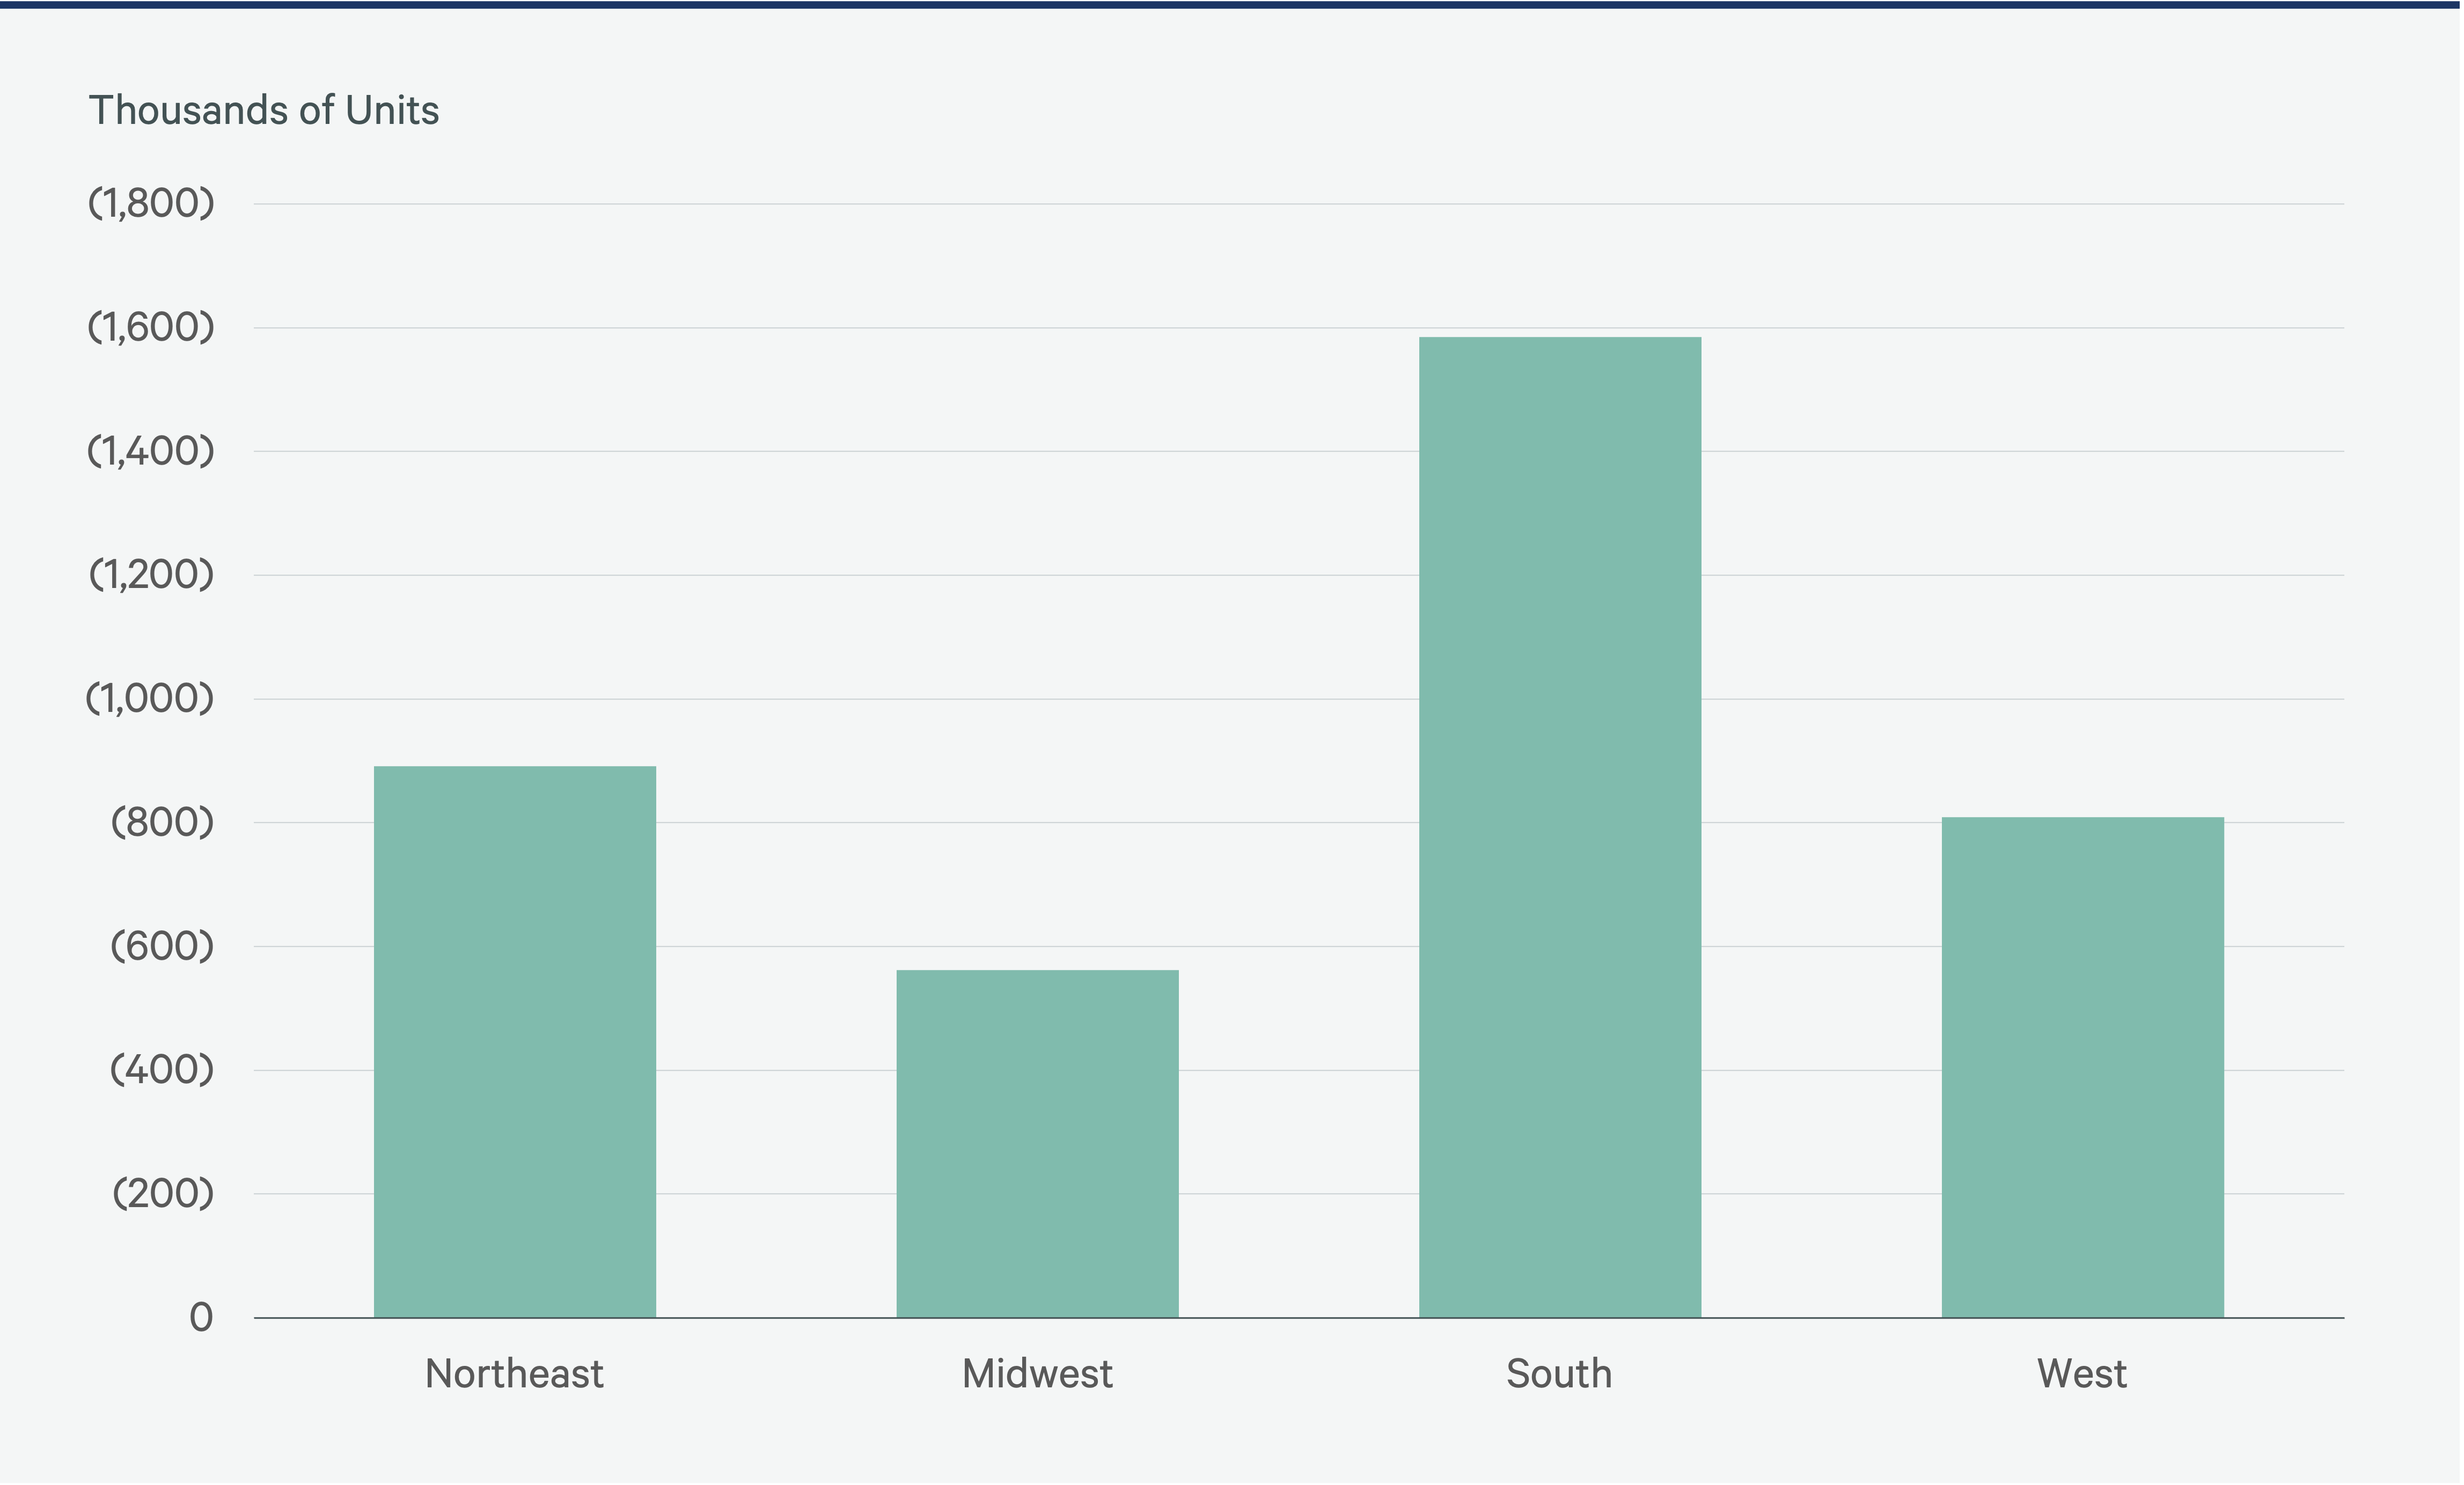
Regional Share of Housing Shortage
The shortage is most prevalent in the South, nearly double that of both the West and Northeast.
Figure 4
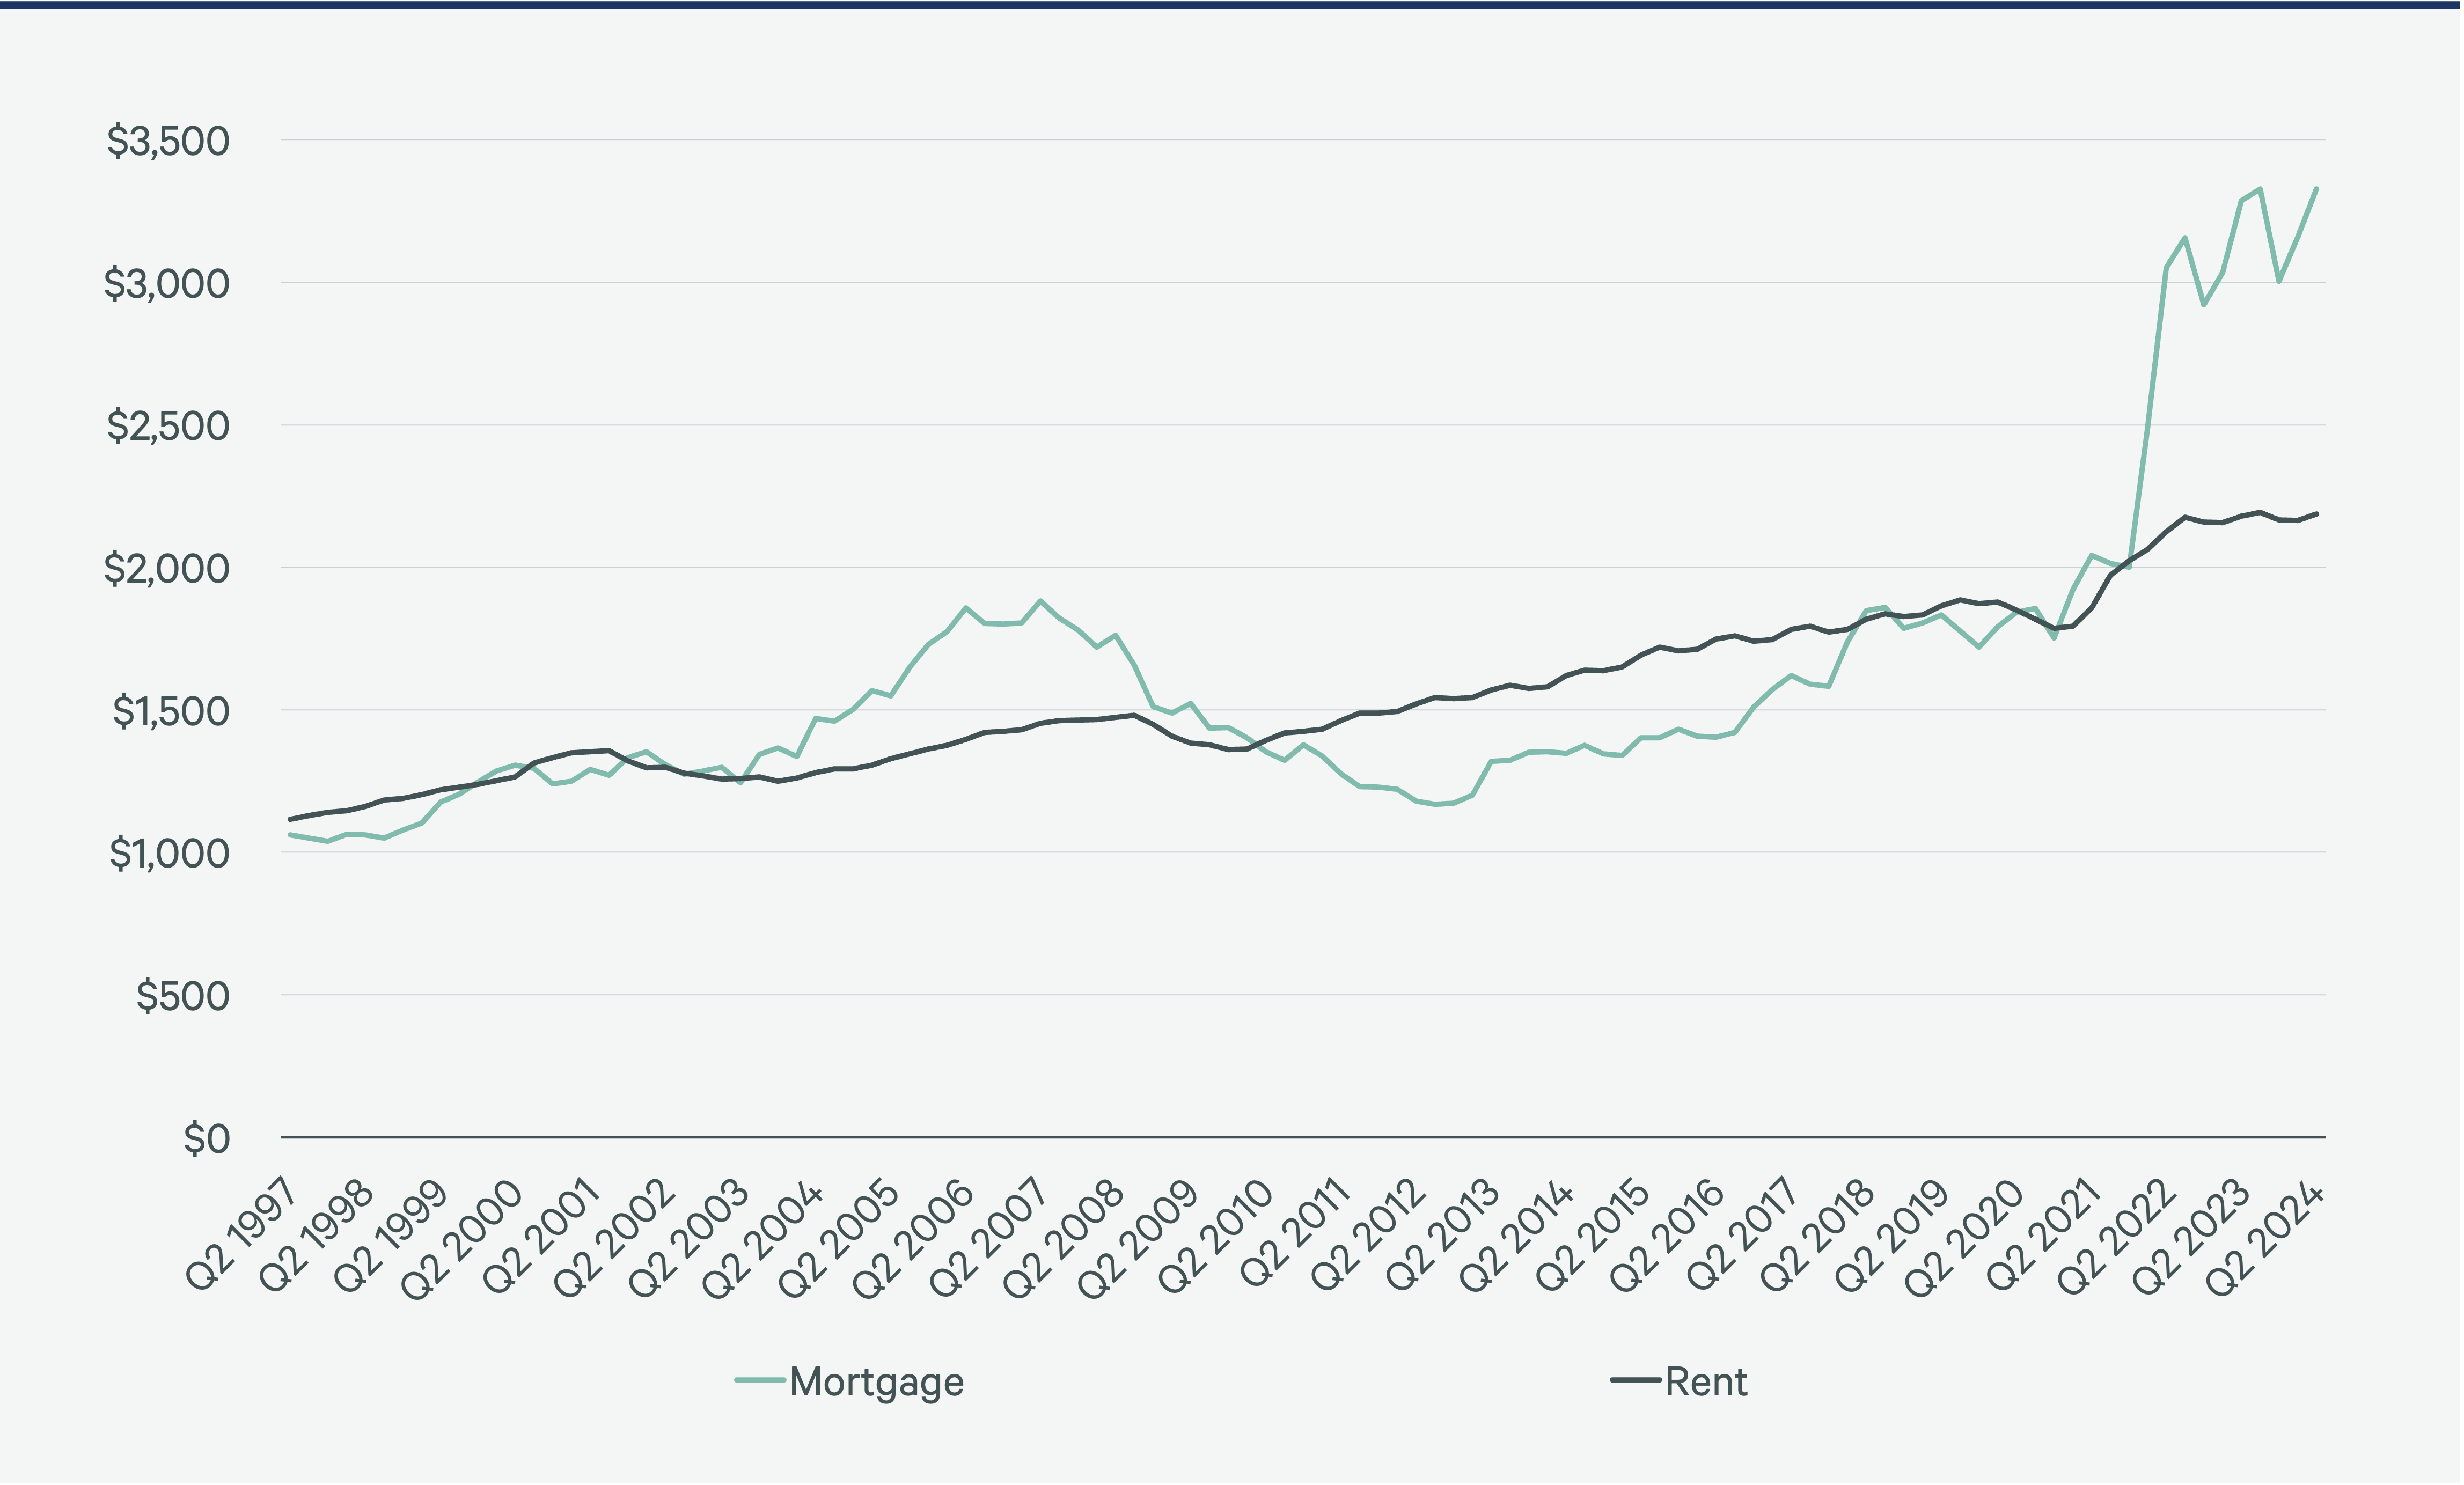
Average Monthly Mortgage Payment vs. Monthly Rent
The average monthly mortgage payment for a newly purchased home was 52% higher than the average monthly rent payment in Q2 2024. Although this home ownership premium is expected to decline with lower interest rates, it likely will remain elevated over the next few years.
Additional home ownership costs like insurance, taxes and maintenance make home ownership even more costly than renting. This cost differential will continue to drive renter demand.
Figure 5
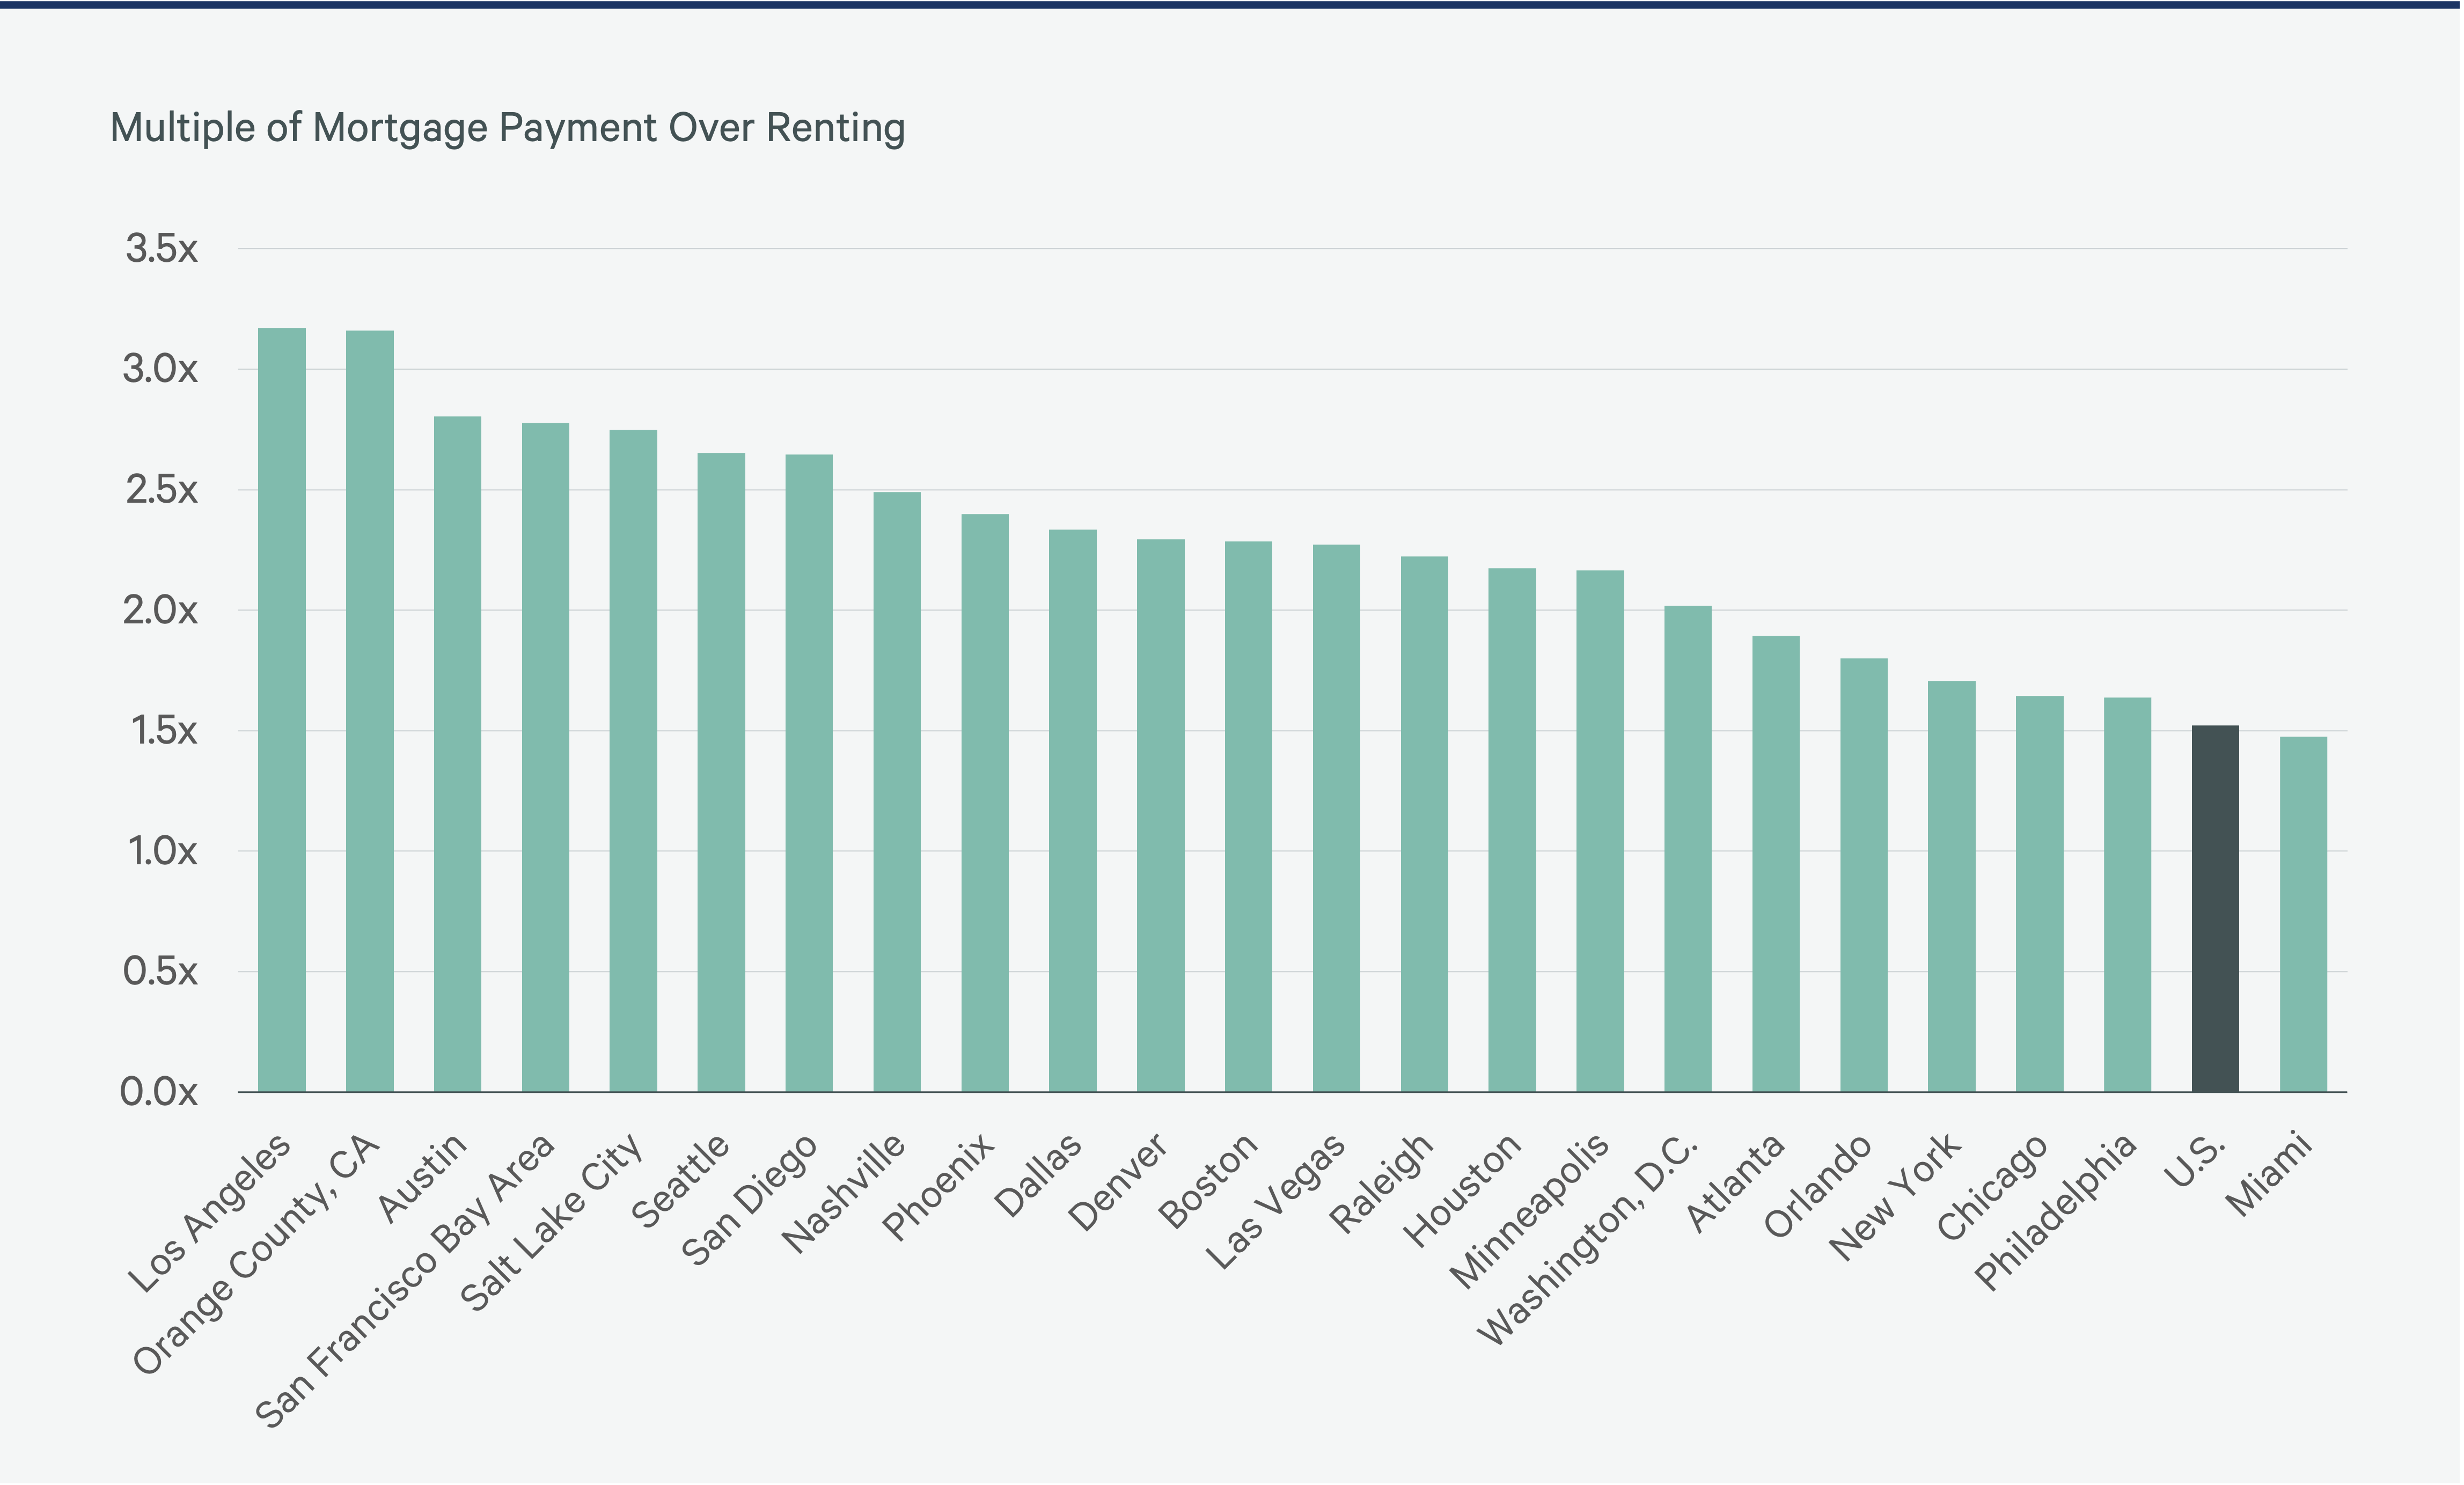
Monthly Payment Premium of Owning Over Renting
Owning a home—especially on the West Coast—is a challenge because of dramatic home price appreciation and a rapid rise in mortgage rates. While it is 1.5 times as much for a newly originated mortgage payment vs. a new lease payment on average nationally, in some markets it is as much as 2.5 to 3 times more.
Figure 6
BTR Market Overview
Current Landscape, Active Markets & Opportunities
Current BTR Market Overview
The BTR asset class offers many opportunities for interested investors via the following market dynamics:
- Rising demand from shifts in housing preferences.
- Helping to meet demand for single-family living by increasing housing supply.
- Superior revenue growth.
- Less resident turnover than traditional multifamily.
- Attractive alternative to renters of Scattered SFR, who are often 35+ years old.
Figure 7
1.5%
Q2 2024 Rent Growth
Source: CBRE Research, Yardi Matrix, July 2024.
6.9%
Vacancy Rate
Source: CBRE Research, Yardi Matrix, July 2024.
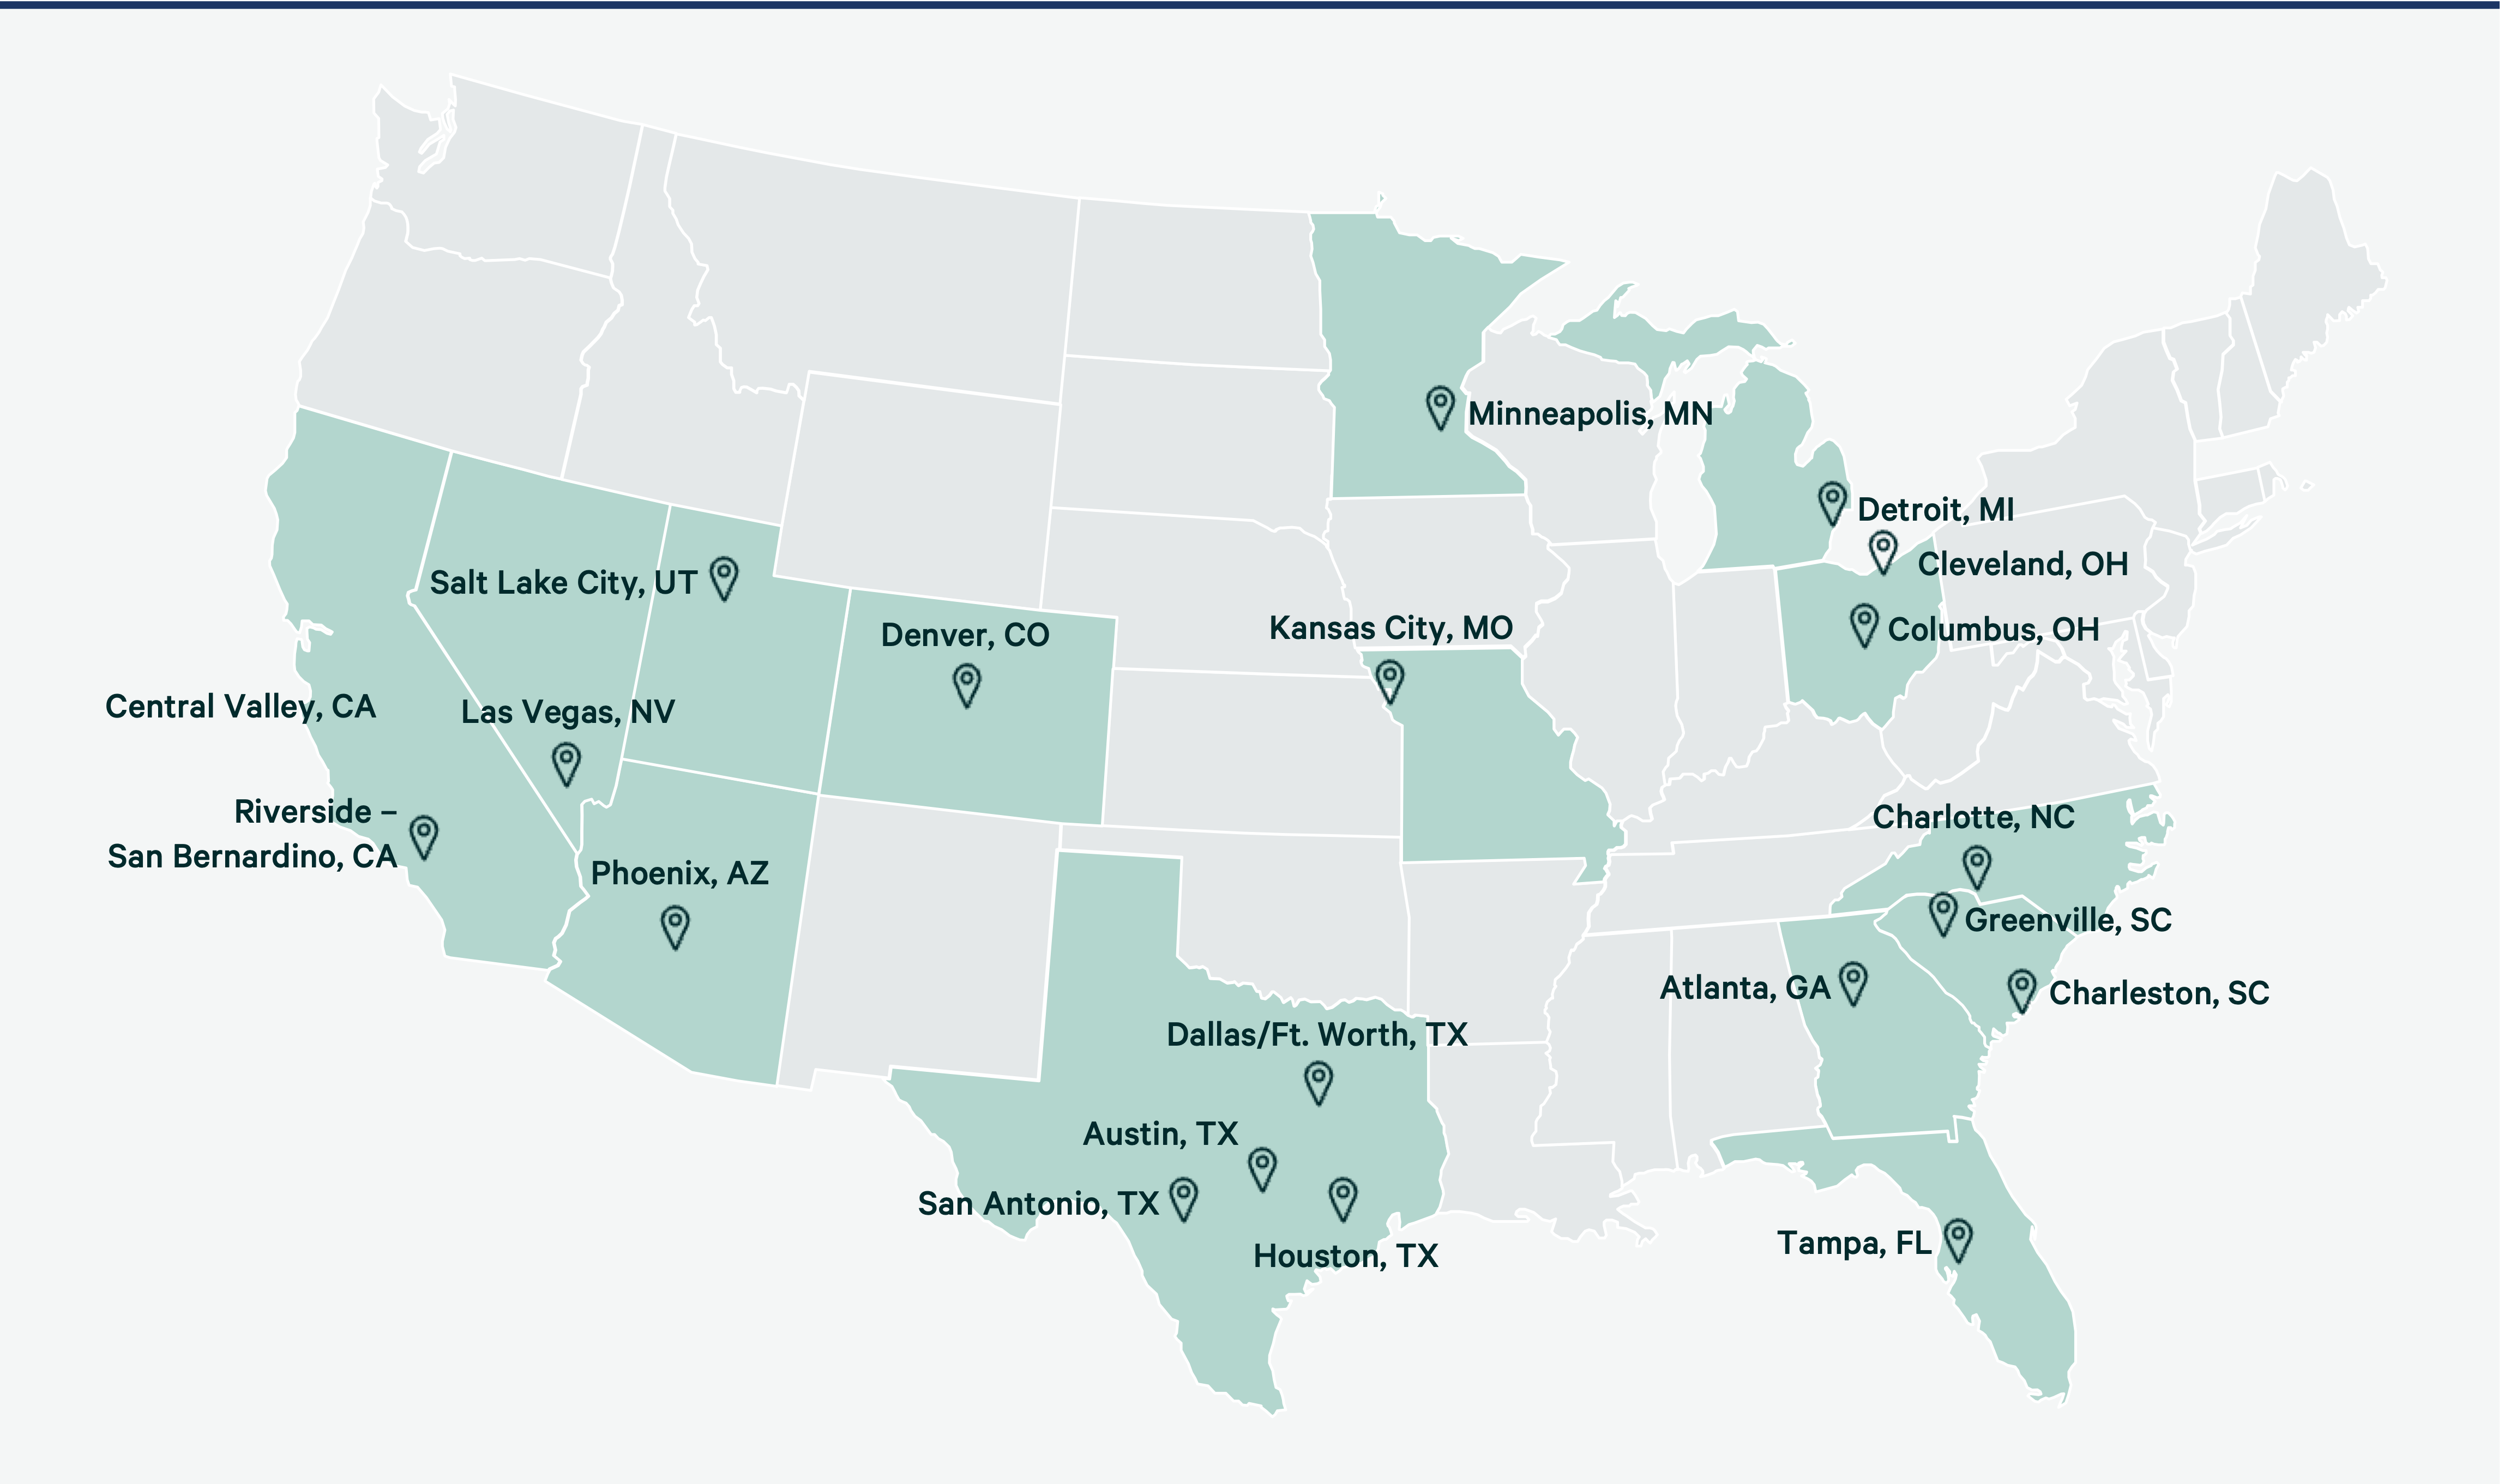
Most Established BTR Markets
- Phoenix and Dallas-Ft. Worth are the nation’s biggest BTR markets, both with more than 10,000 units each.
- Certain suburban markets, mostly in the West, have some of the most expensive BTR inventory in the country.
- All four major Texas markets (Dallas-Ft. Worth, Houston, Austin and San Antonio) are among the top 20 for total BTR inventory, having benefited from recent Sun Belt in-migration over the past few years.
- Three Midwestern markets (Columbus, Kansas City and Detroit) are are among the top 10 for total BTR inventory.
Figure 8
SFR vs. Multifamily Market Sizes
There were approximately 23 million SFR units nationwide in 2022, including two- to four-unit properties (primarily townhouses). There were also 23 million multifamily properties with five or more units each. Almost all detached SFRs were originally for-sale homes.
Figure 9
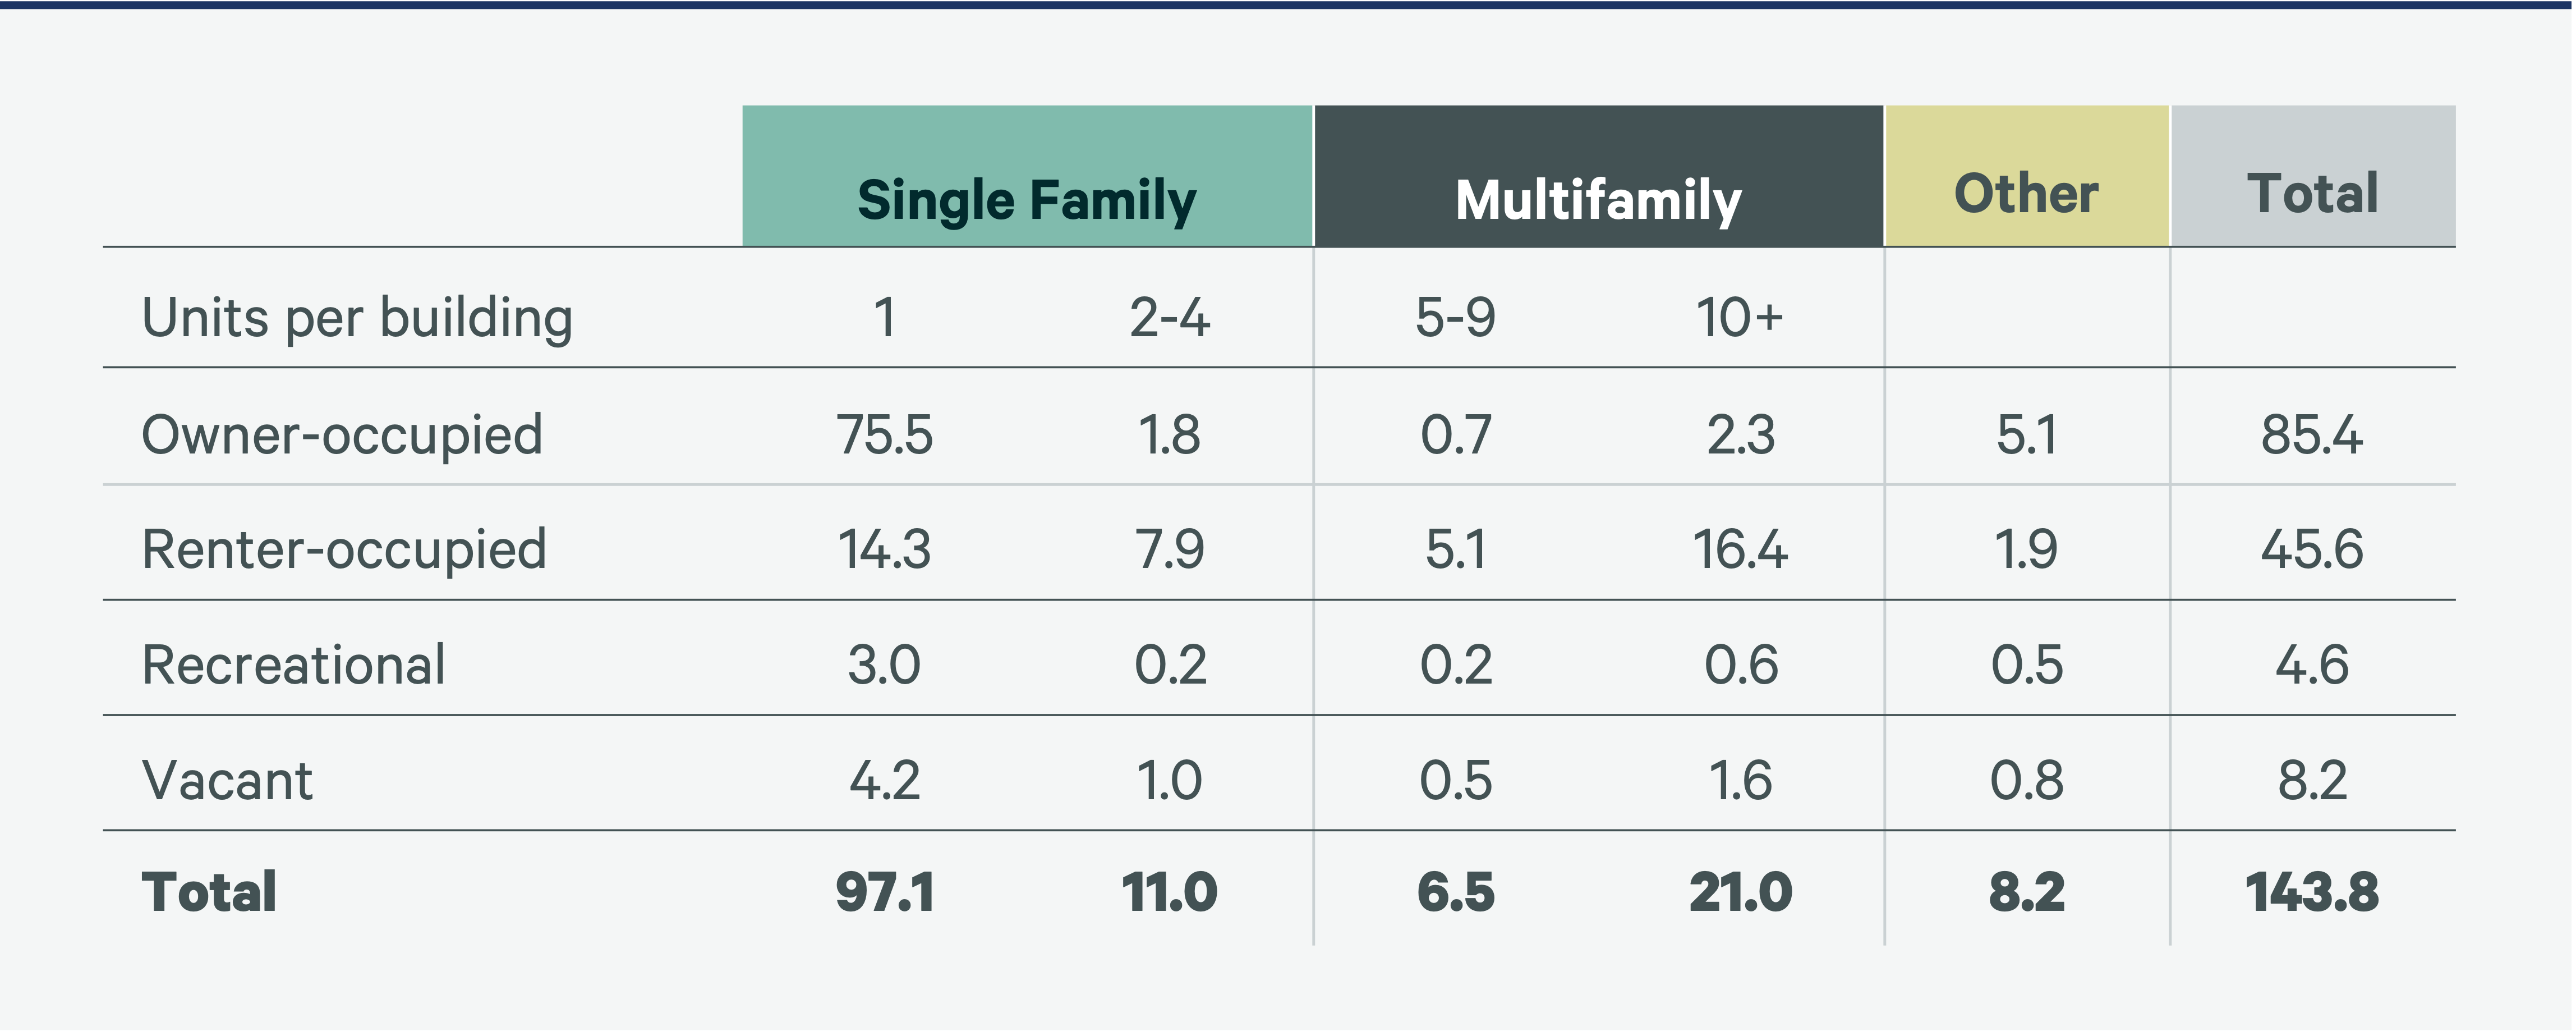
Figure 10
-1.2M
There are 1.2M fewer single-family rental homes since 2016 (a 7% loss in inventory)
Source: CBRE Research.
<2%
of the SFR market is institutionally owned
Source: NRHC.
350K
BTR units (1.5% of the total SFR market)
Source: NRHC.
2%-5%
of single-family construction is BTR
Source: John Burns Real Estate Consulting, U.S. Census Bureau.
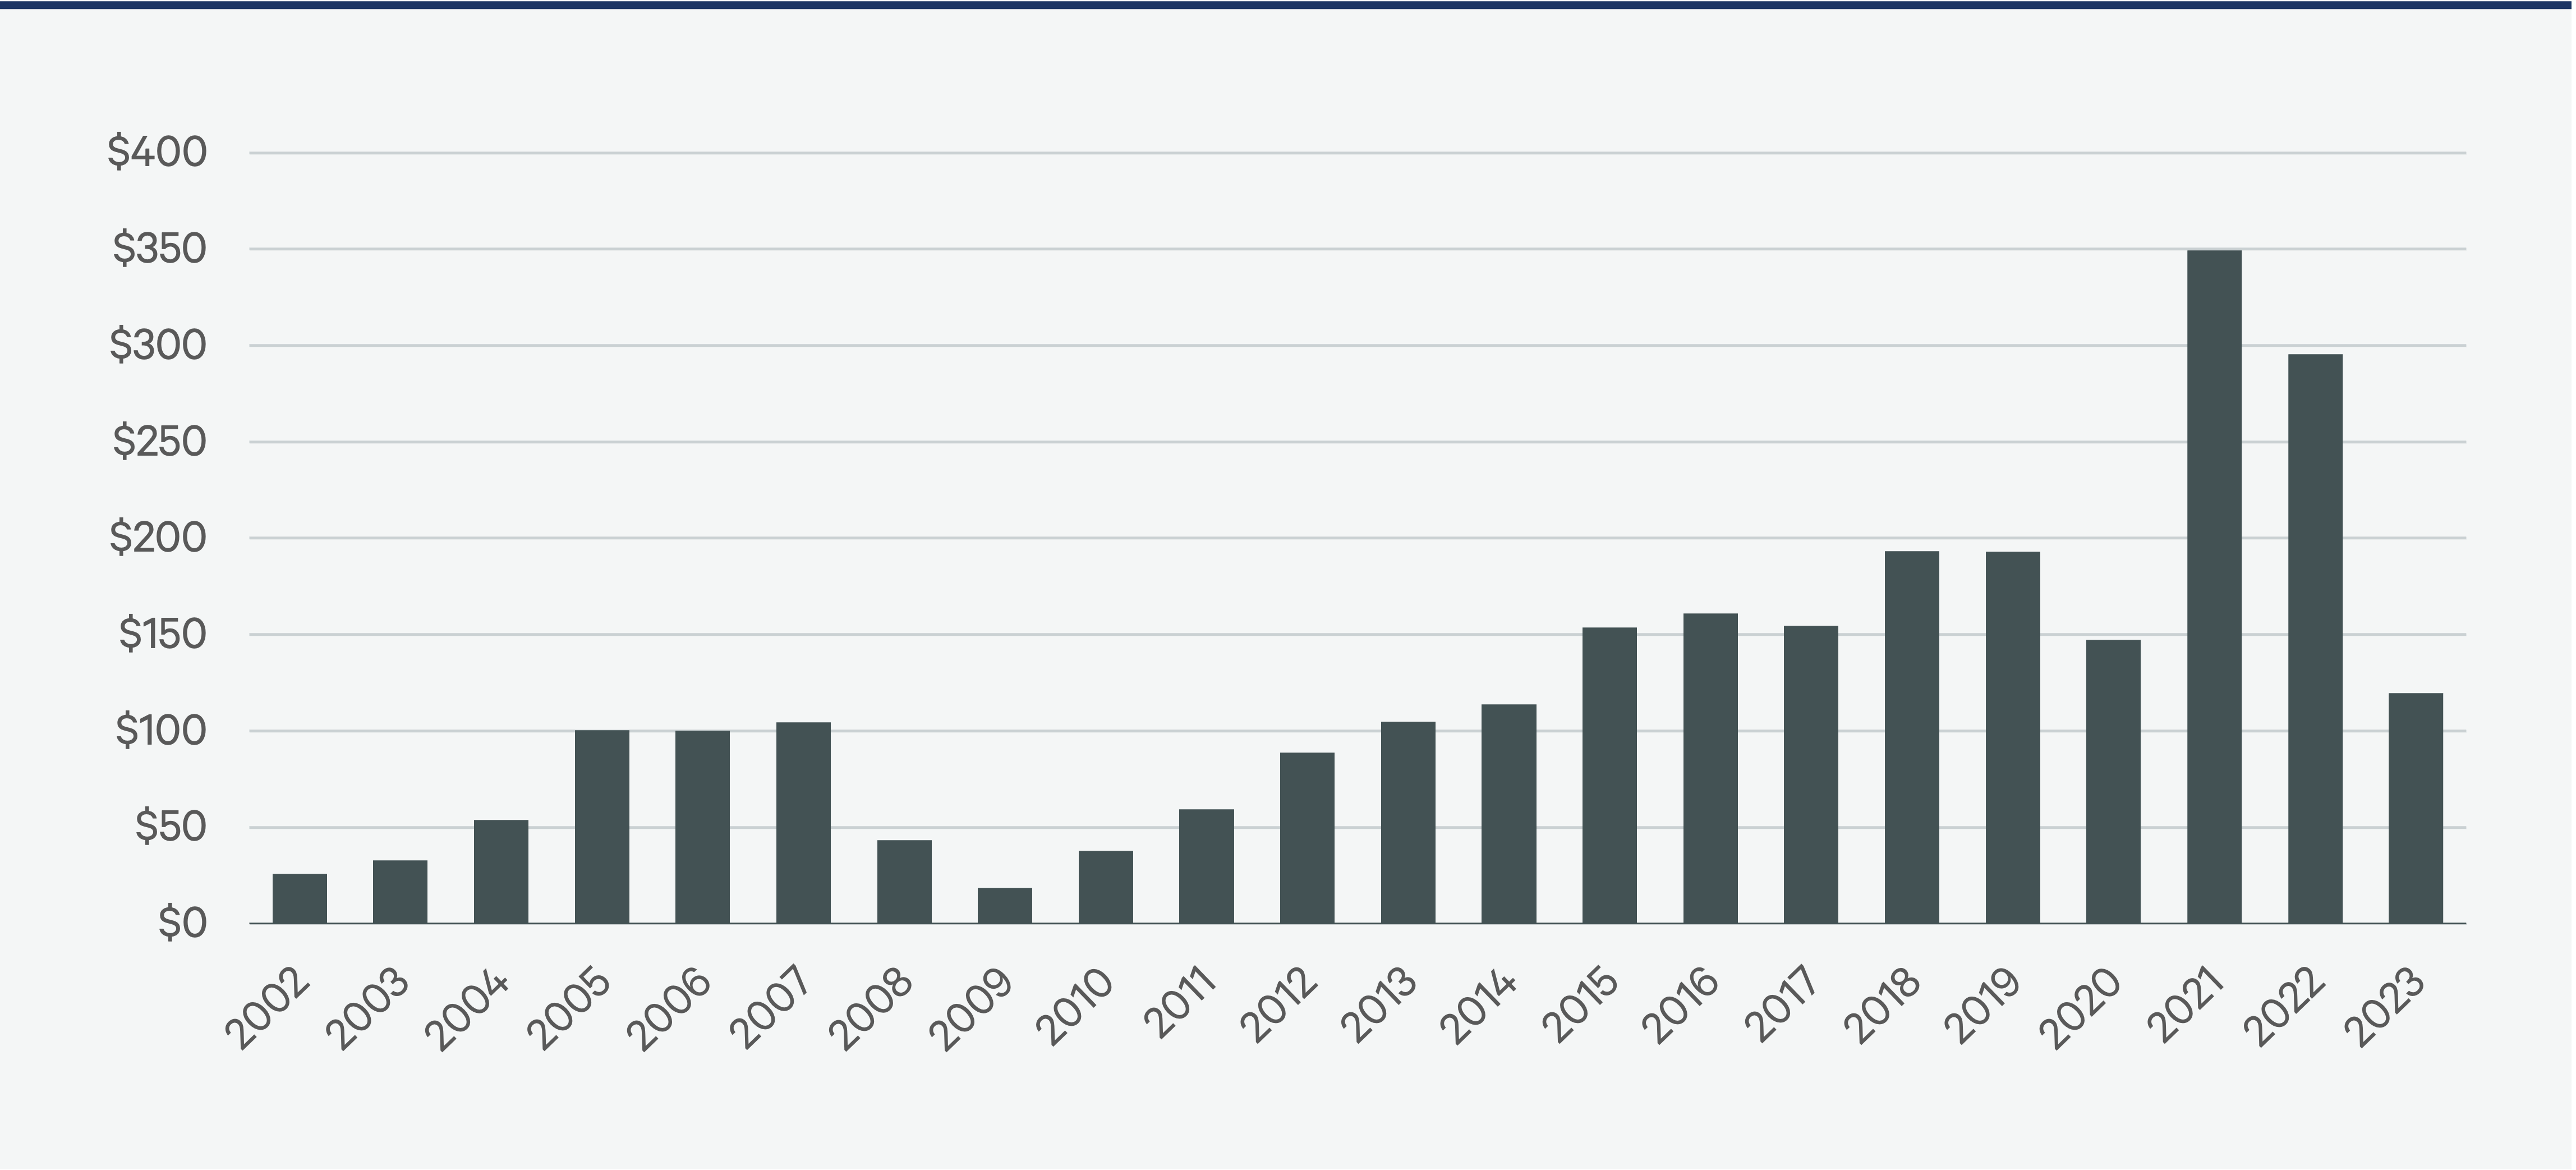
Annual BTR Investment Volume
Although BTR investment volume totaling $1.6 billion in 2023 was down by 40% from 2021 and 2022, it was more than double the preceding five-year pre-pandemic average. Traditional multifamily investment volume was down by 30% over the same time frame.
As investors reallocate their capital to favor the multifamily and industrial sectors, we expect BTR investment volume will grow.
Figure 11a: Annual Sales of BTR Communities (billions)

Figure 11b: Annual Sales of Apartments (billions)
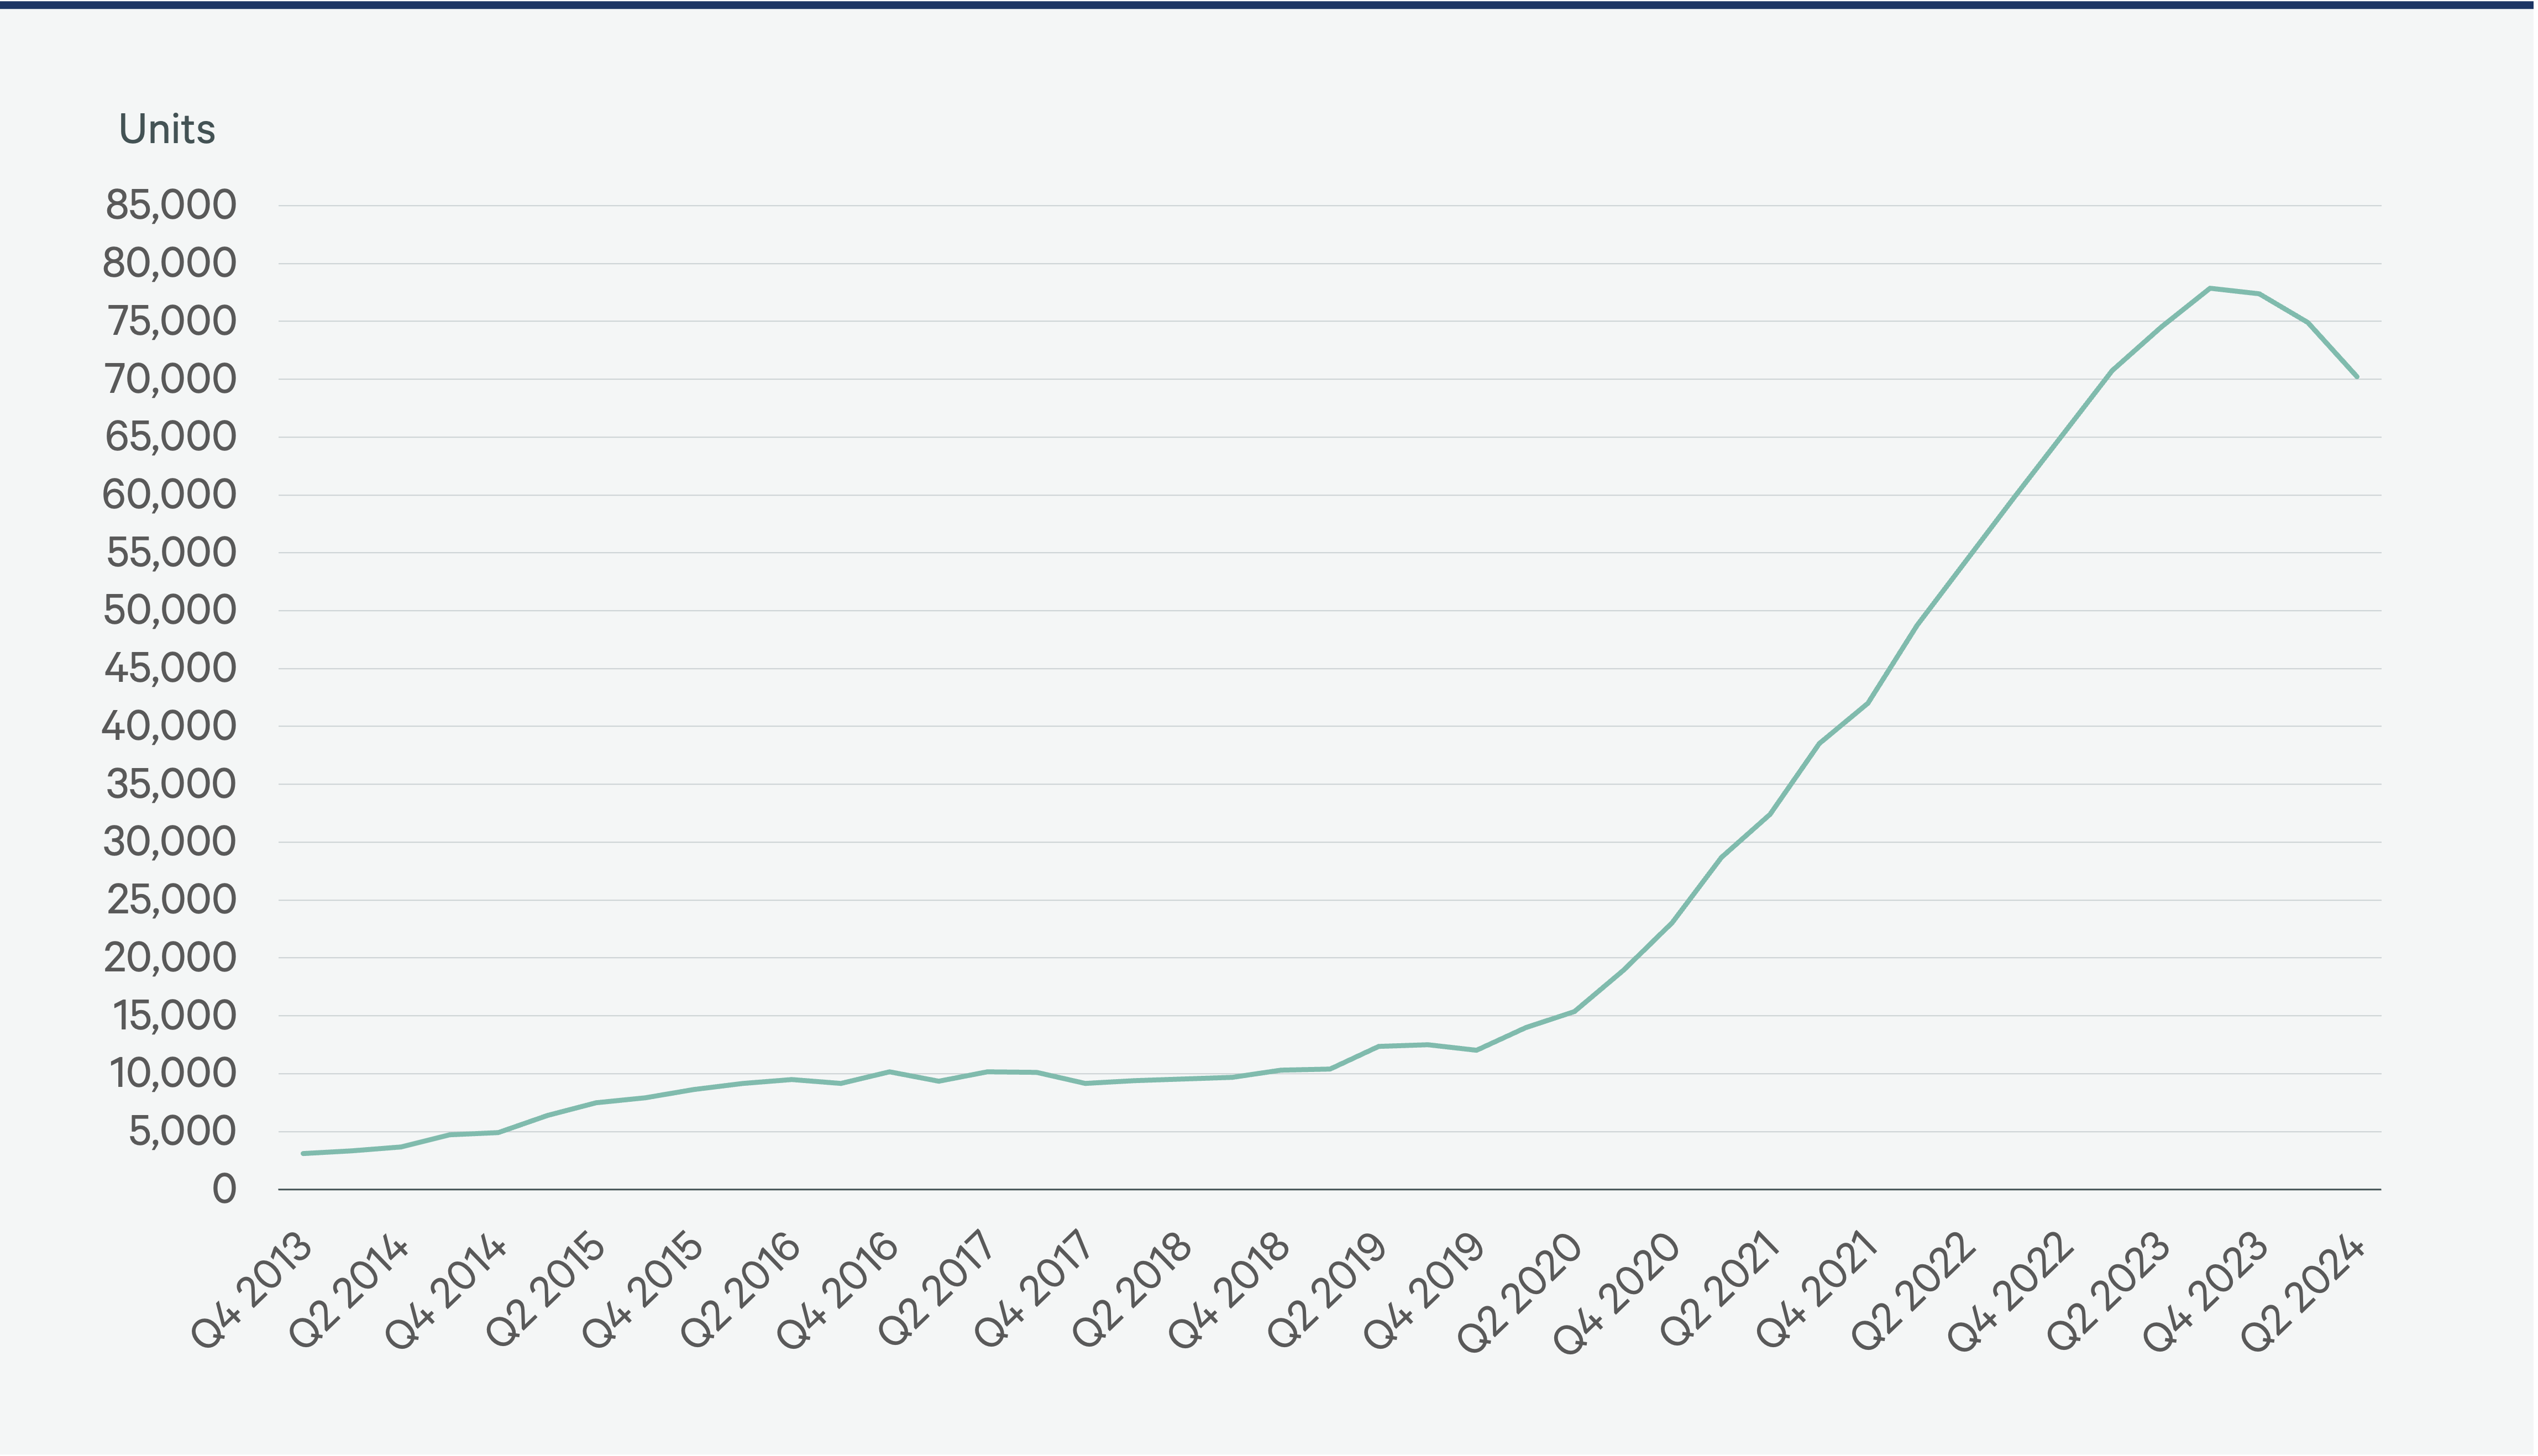
BTR Units Under Construction
Total U.S. BTR inventory remains relatively small at approximately 350,000 units. BTR development accelerated in recent years, peaking at almost 80,000 units under construction in mid-2023. However, starts have slowed since then due to increased vacancies, lower rent growth, higher borrowing costs and tighter lending conditions.
Figure 12
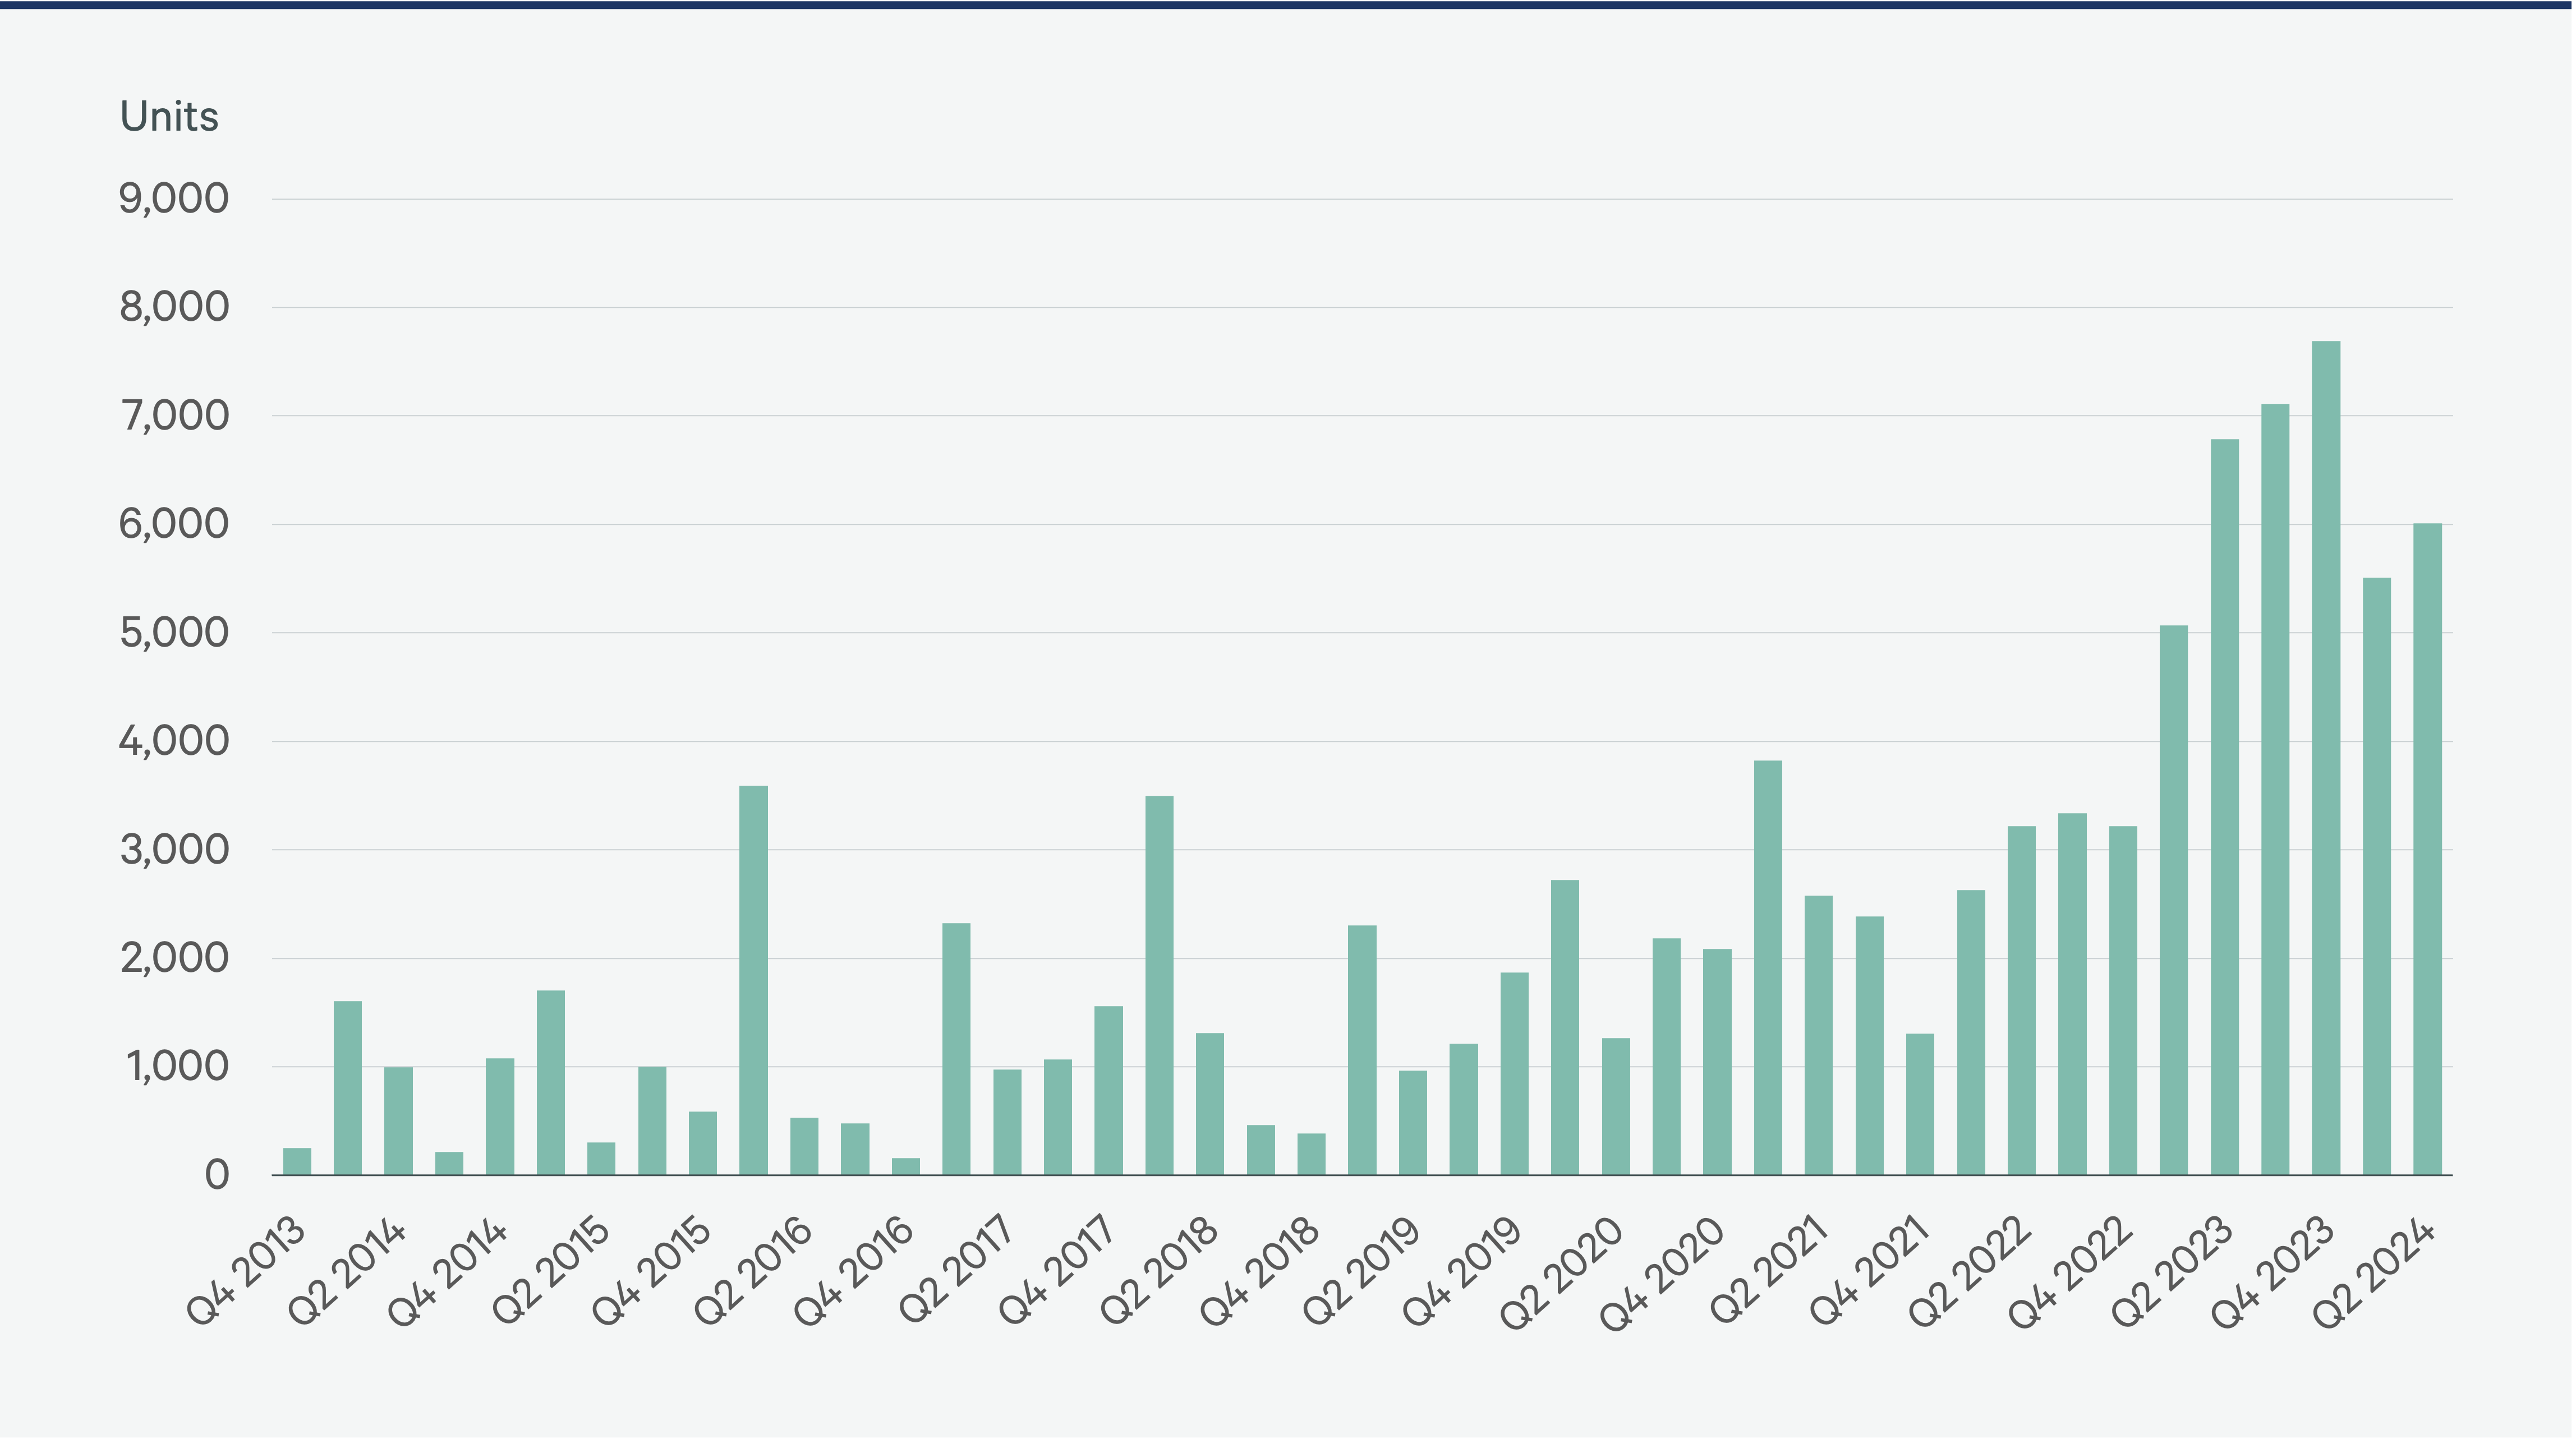
Quarterly BTR Net Absorption
A surge in demand has absorbed the current wave of new construction.
Figure 13
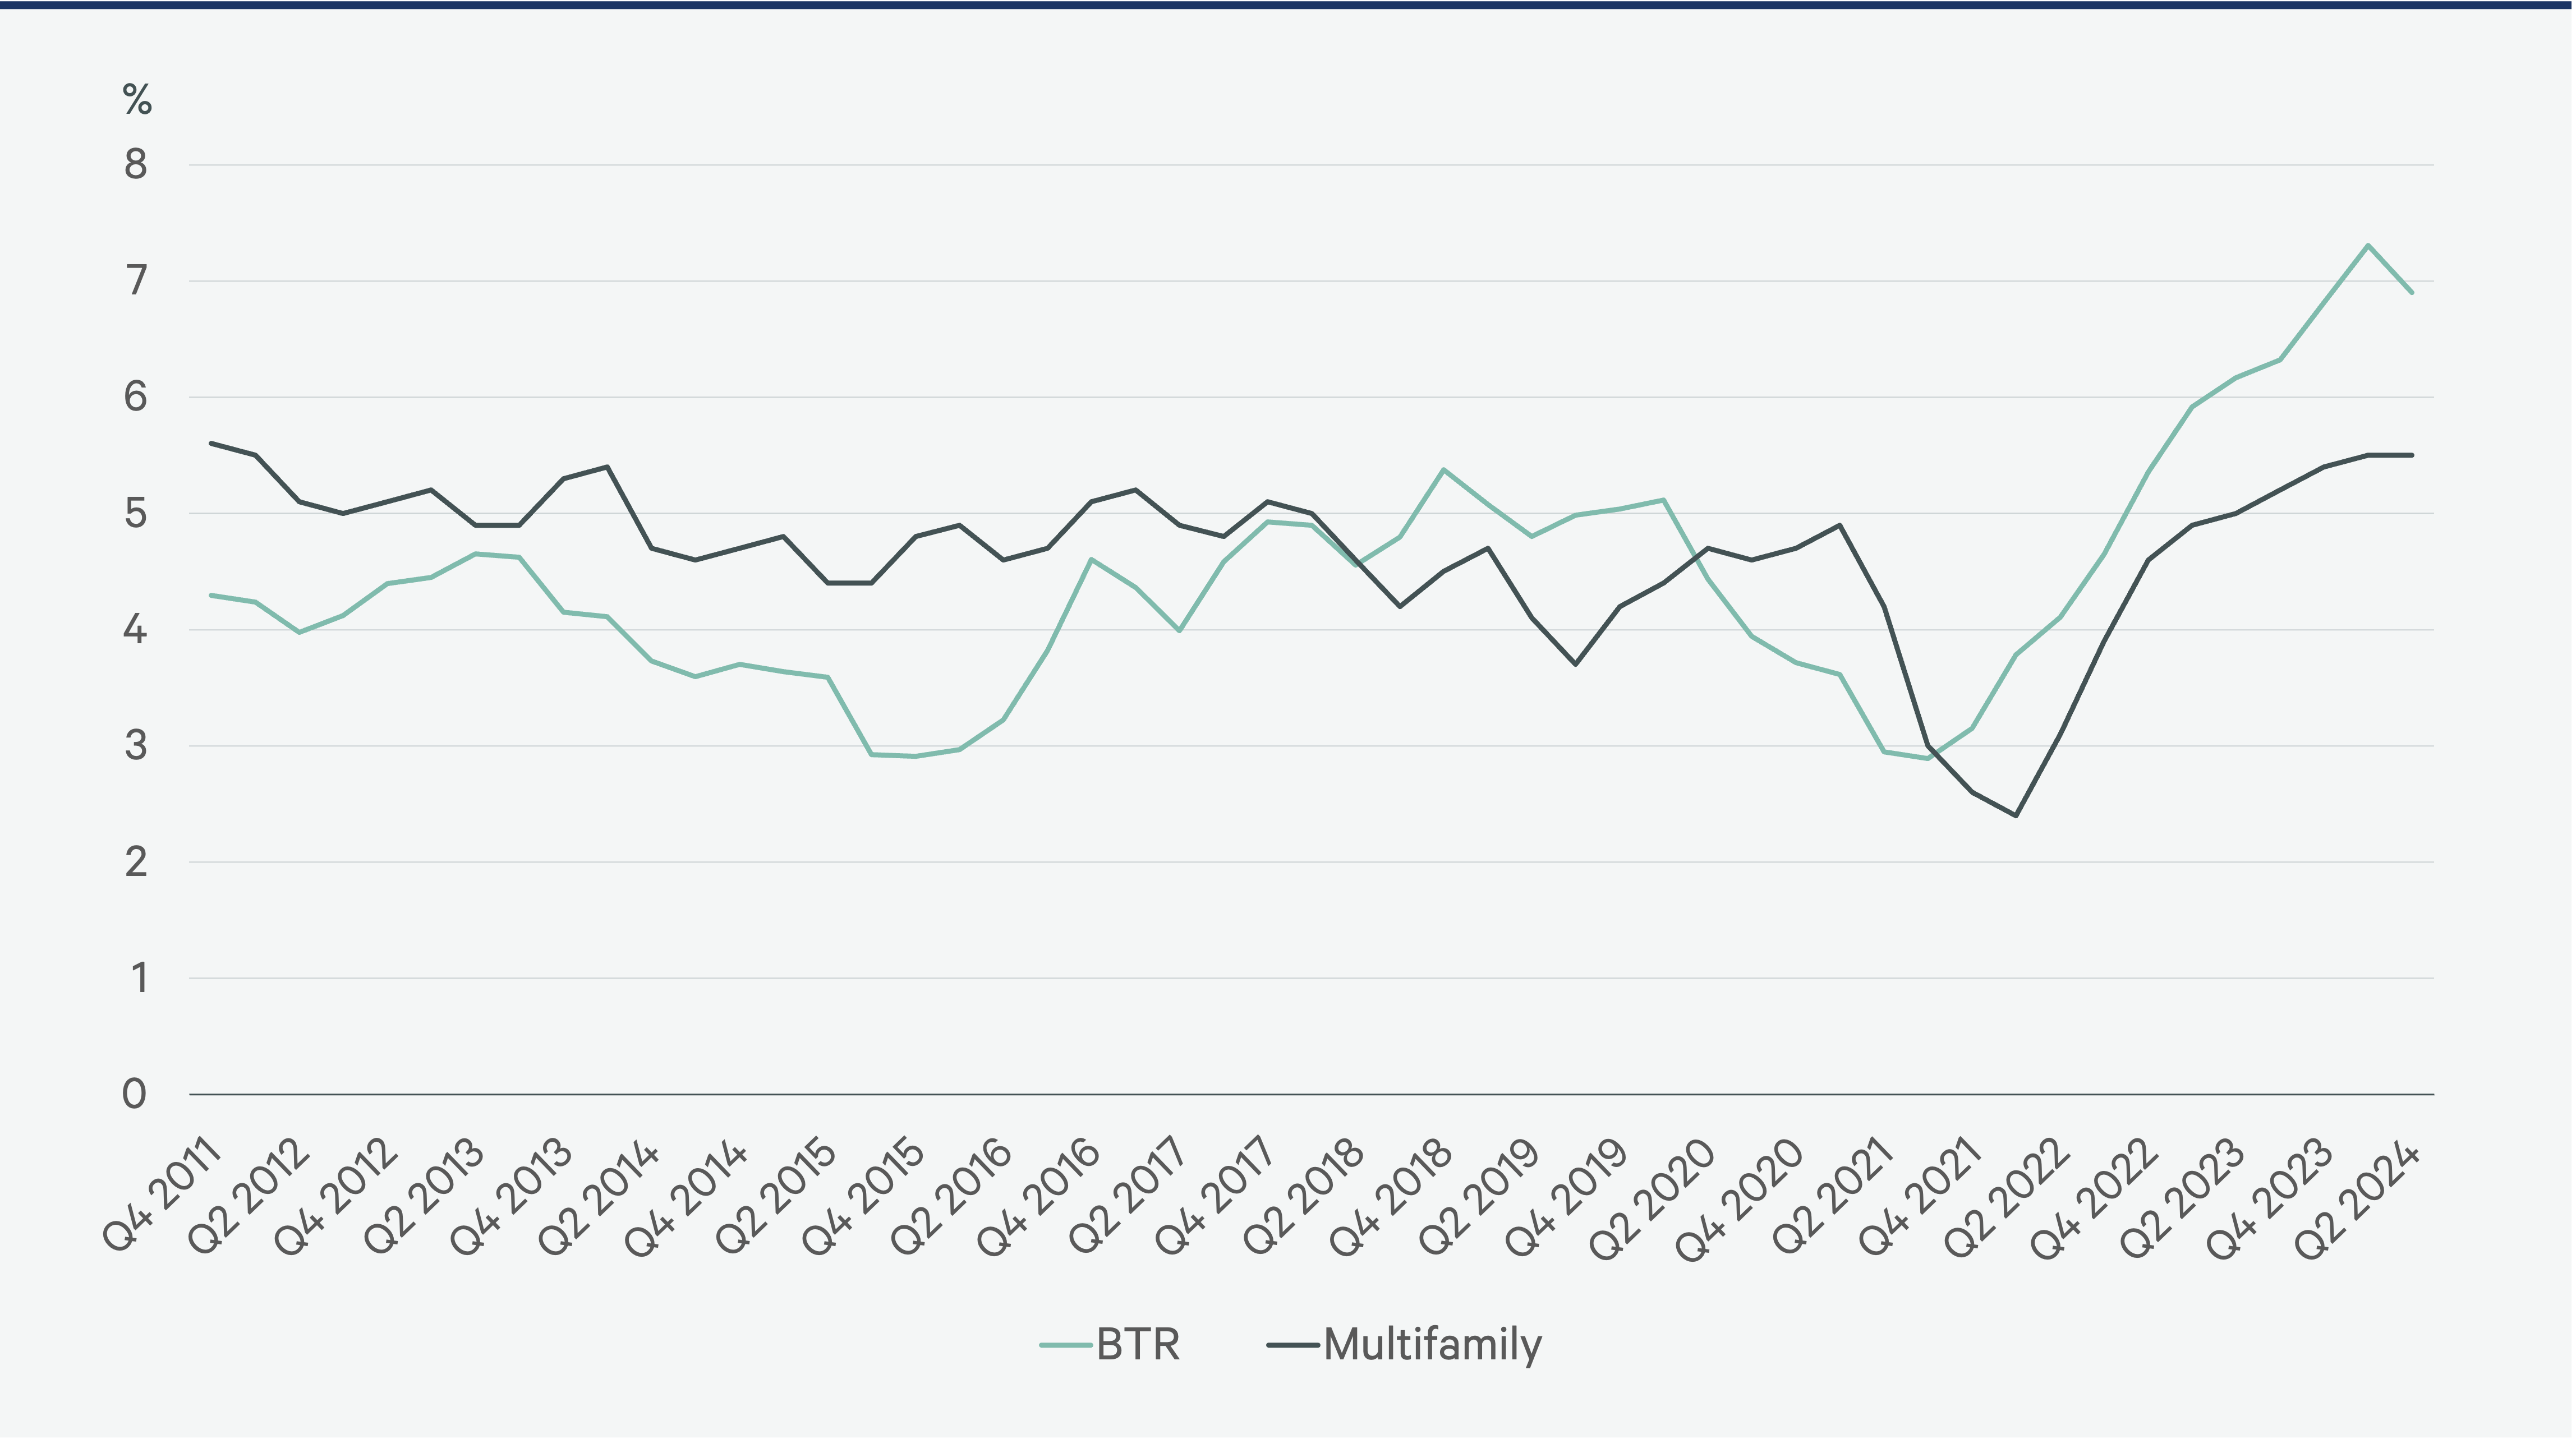
BTR Historical Vacancy Rate
Like the overall multifamily market, the BTR sector has seen a wave of new construction over the past two years. This caused a significant increase in vacancy, even as demand increased. However, for the first time in nearly three years, the overall BTR vacancy rate fell in Q2 2024.
With fewer new starts of BTR communities and as continued strong demand absorbs these new completions, the BTR vacancy rate should continue to stabilize.
Figure 14
Average BTR vs. Multifamily Rent
Monthly BTR rents averaged $2,181 per unit in Q2. BTR rents did not decline during the pandemic because BTR communities benefited from out-migration from high-density urban cores. The larger and less expensive units available in suburban and secondary BTR markets benefited from this shift.
However, with the recent wave of new supply over the past two years, vacancy has increased and rent growth has slowed significantly from the highs of 2021 and 2022.
Figure 15
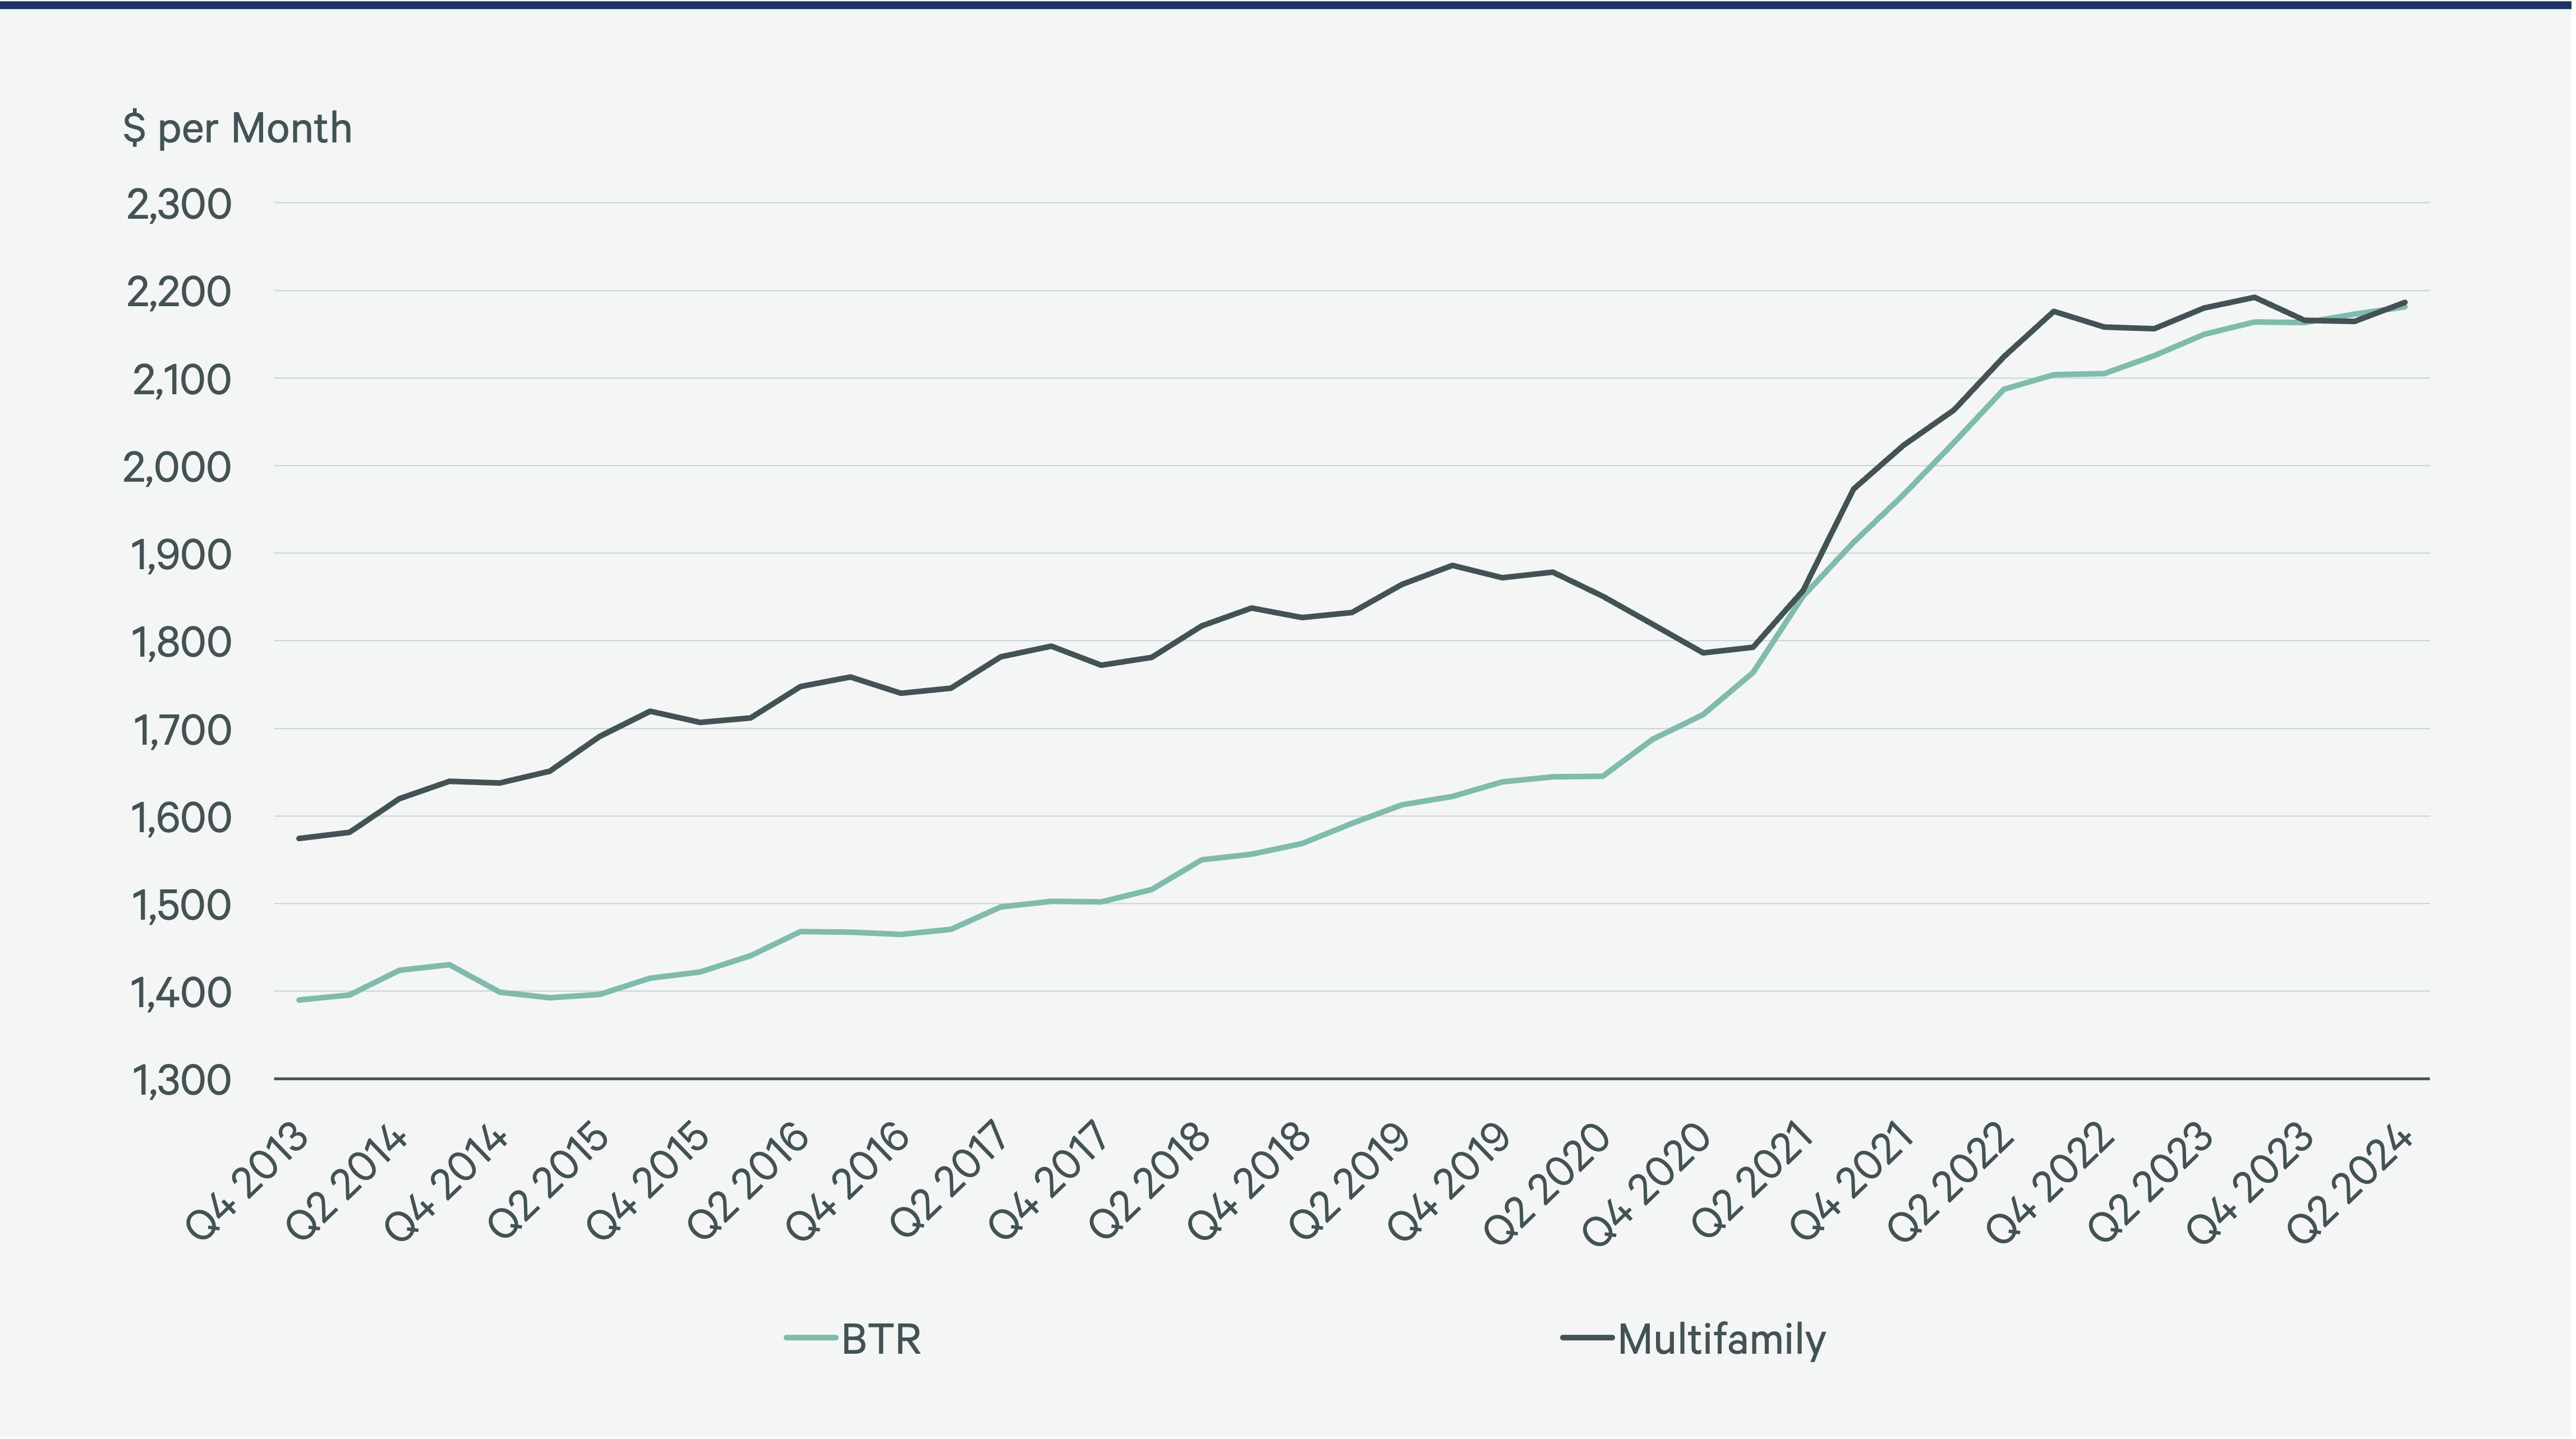
Source: CBRE Research, Yardi Matrix, July 2024.
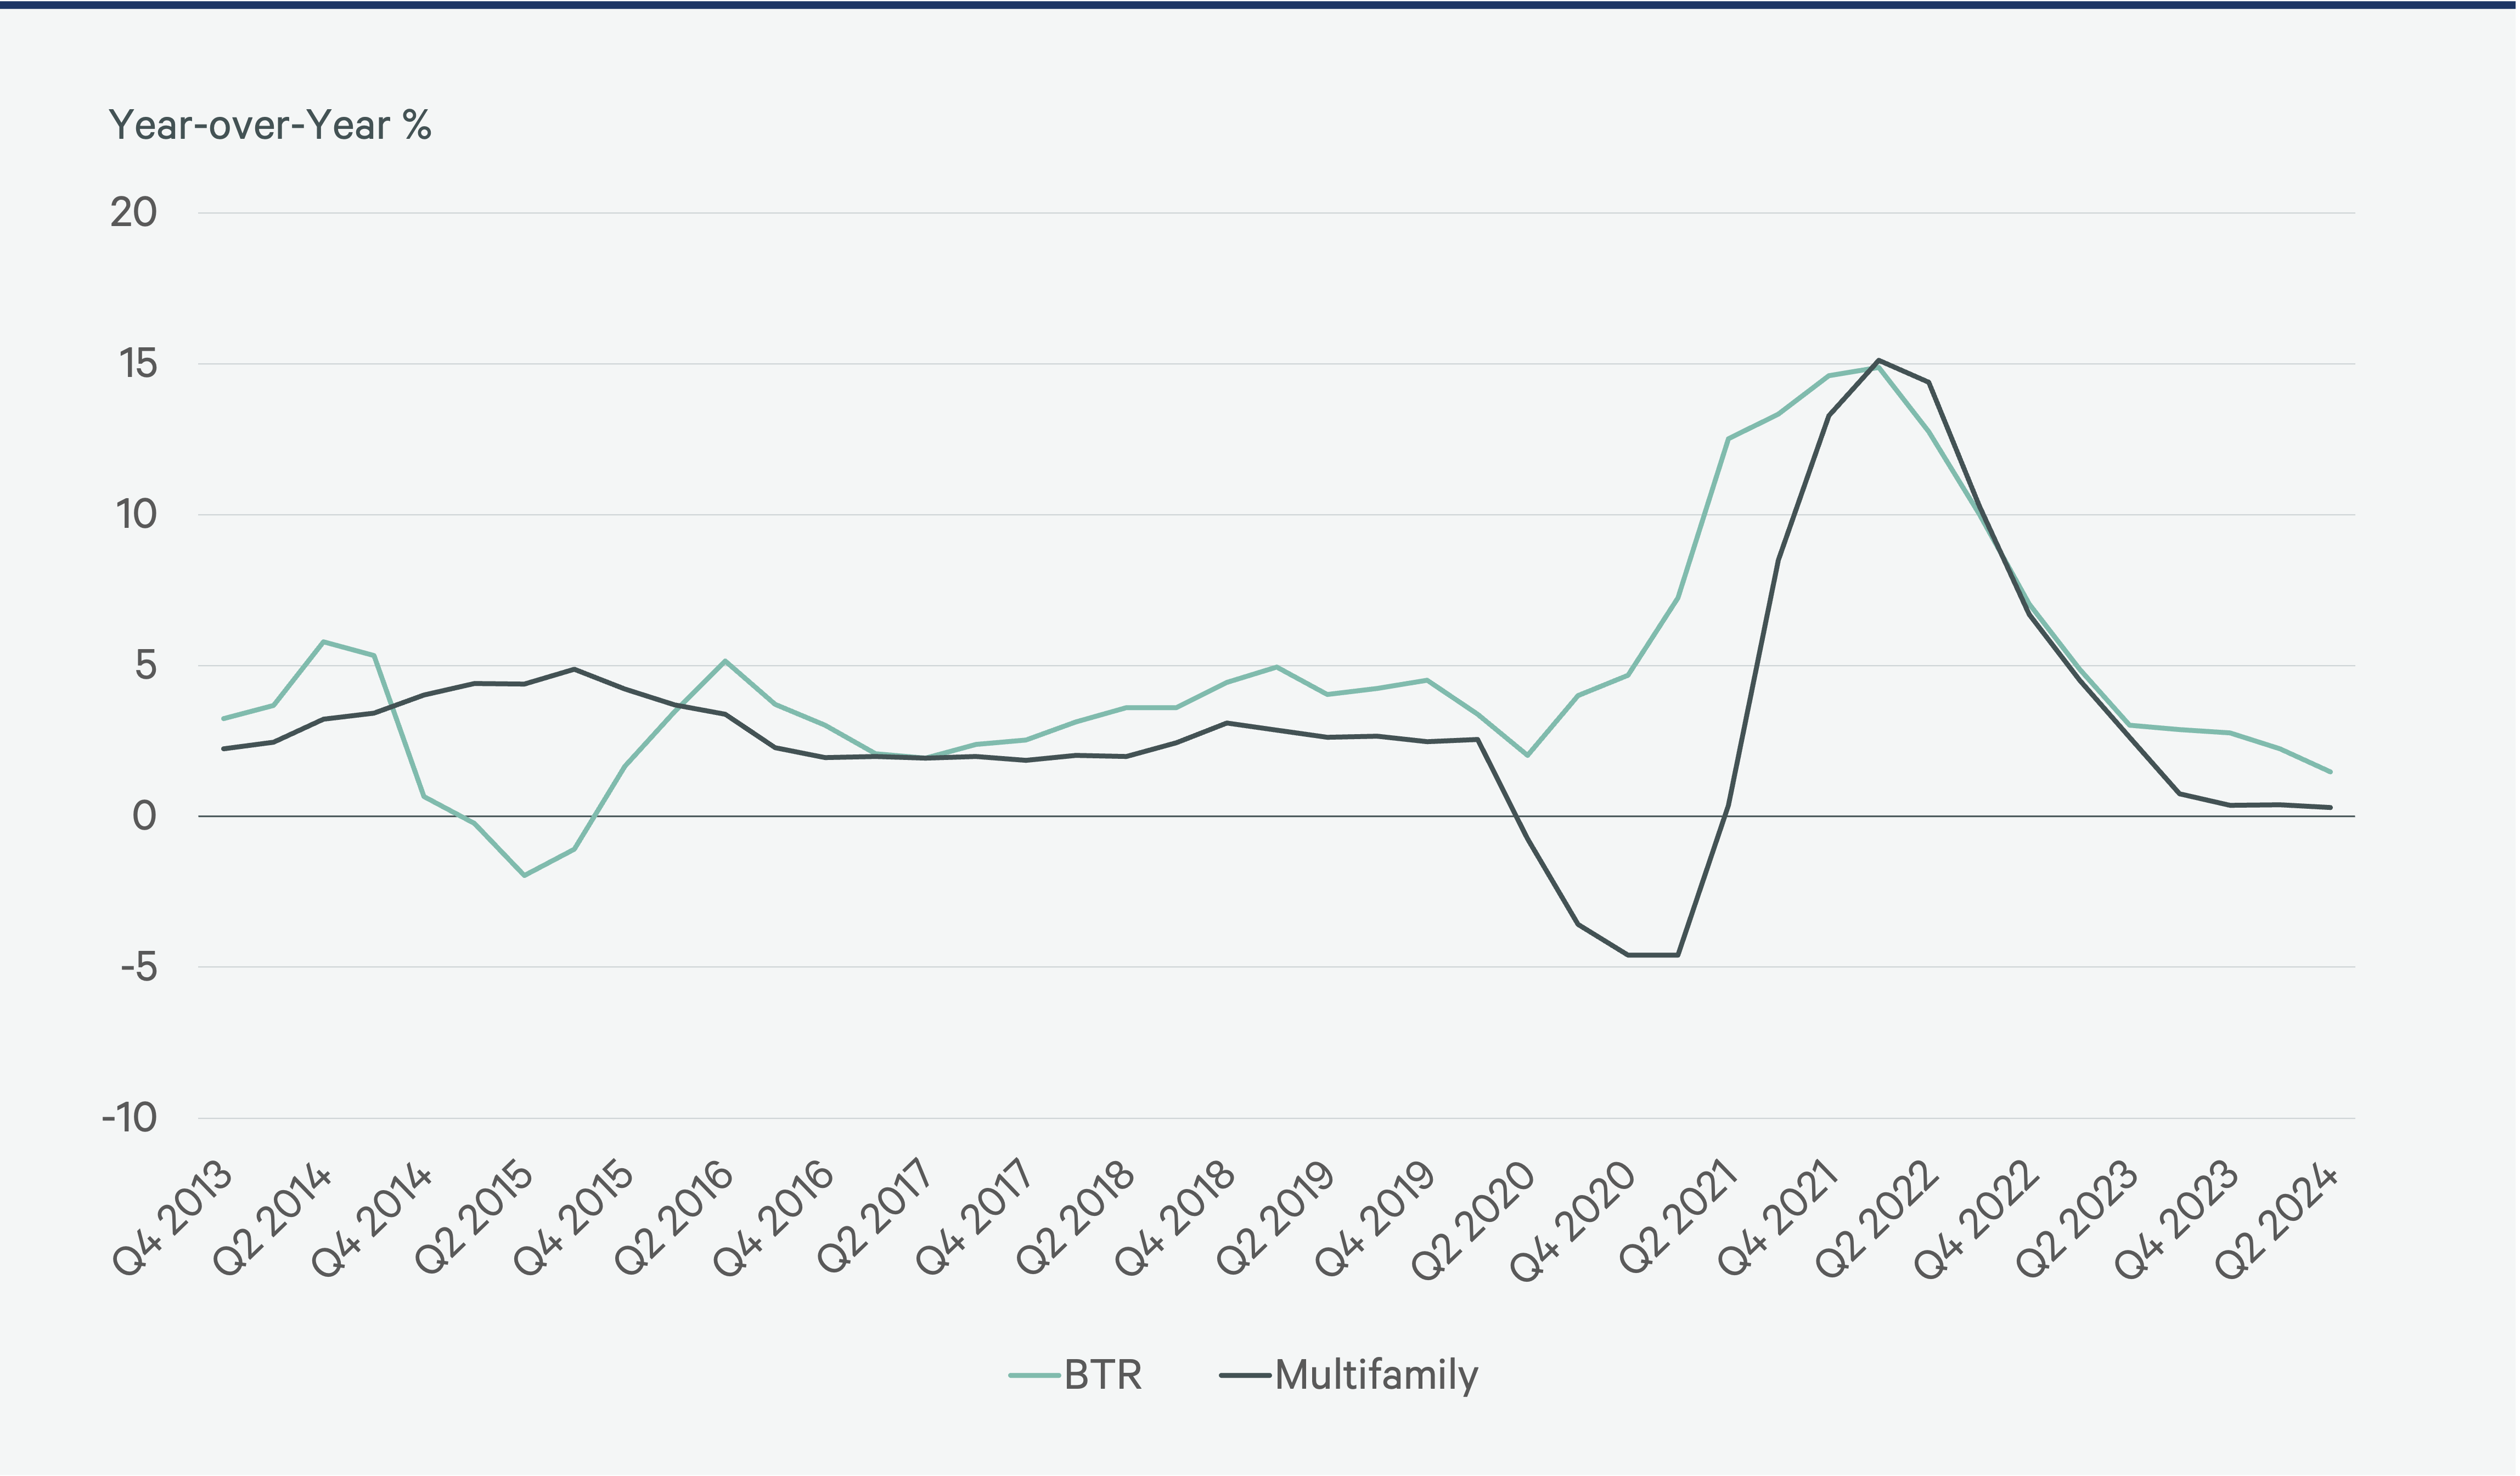
BTR vs. Multifamily Rent Growth
Average BTR rent growth decelerated to 1.5% year-over-year in Q2 2024, largely due to a wave of new supply, but was well above traditional multifamily rent growth of 0.3%. As the BTR market absorbs this new supply and its overall vacancy rate falls to its long-run average, rent growth should accelerate.
Figure 16
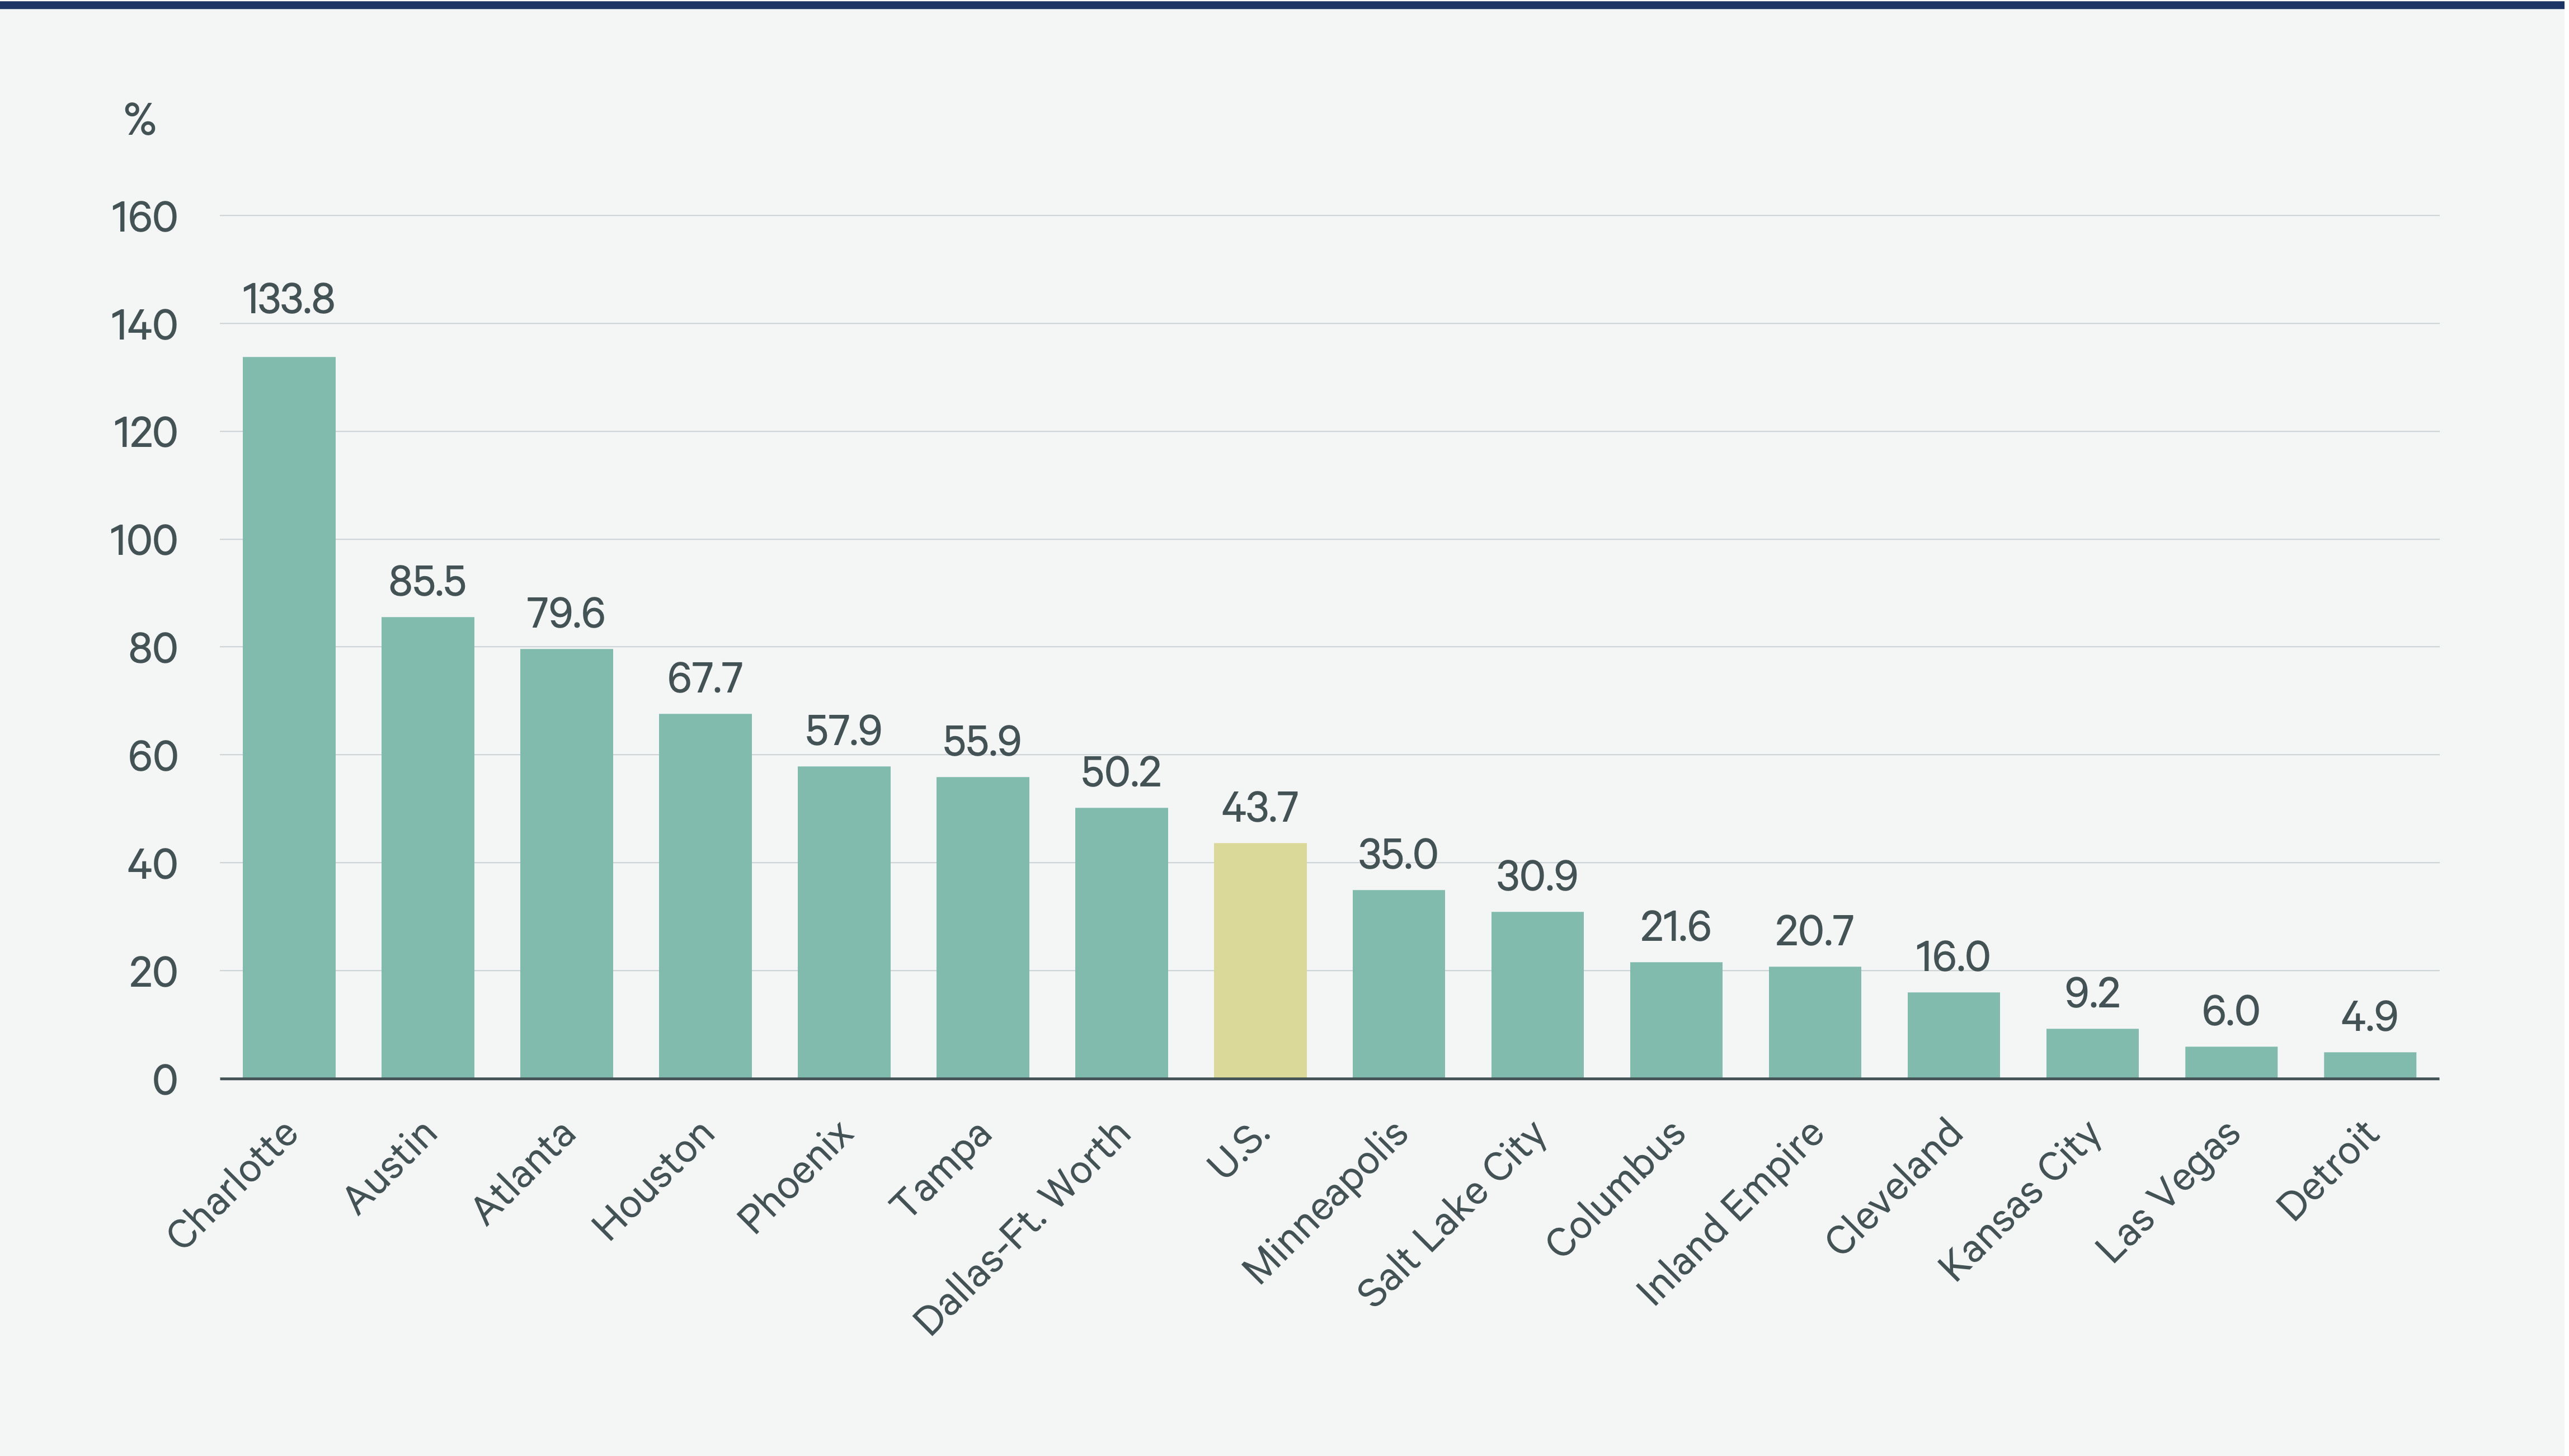
Under Construction as a Percentage of Inventory
Sun Belt markets currently dominate for BTR communities under construction. Charlotte and Austin, for example, have current pipelines that will nearly double their existing BTR inventory.
Total U.S. BTR inventory is expected to increase by nearly 50% over the near term.
Figure 17
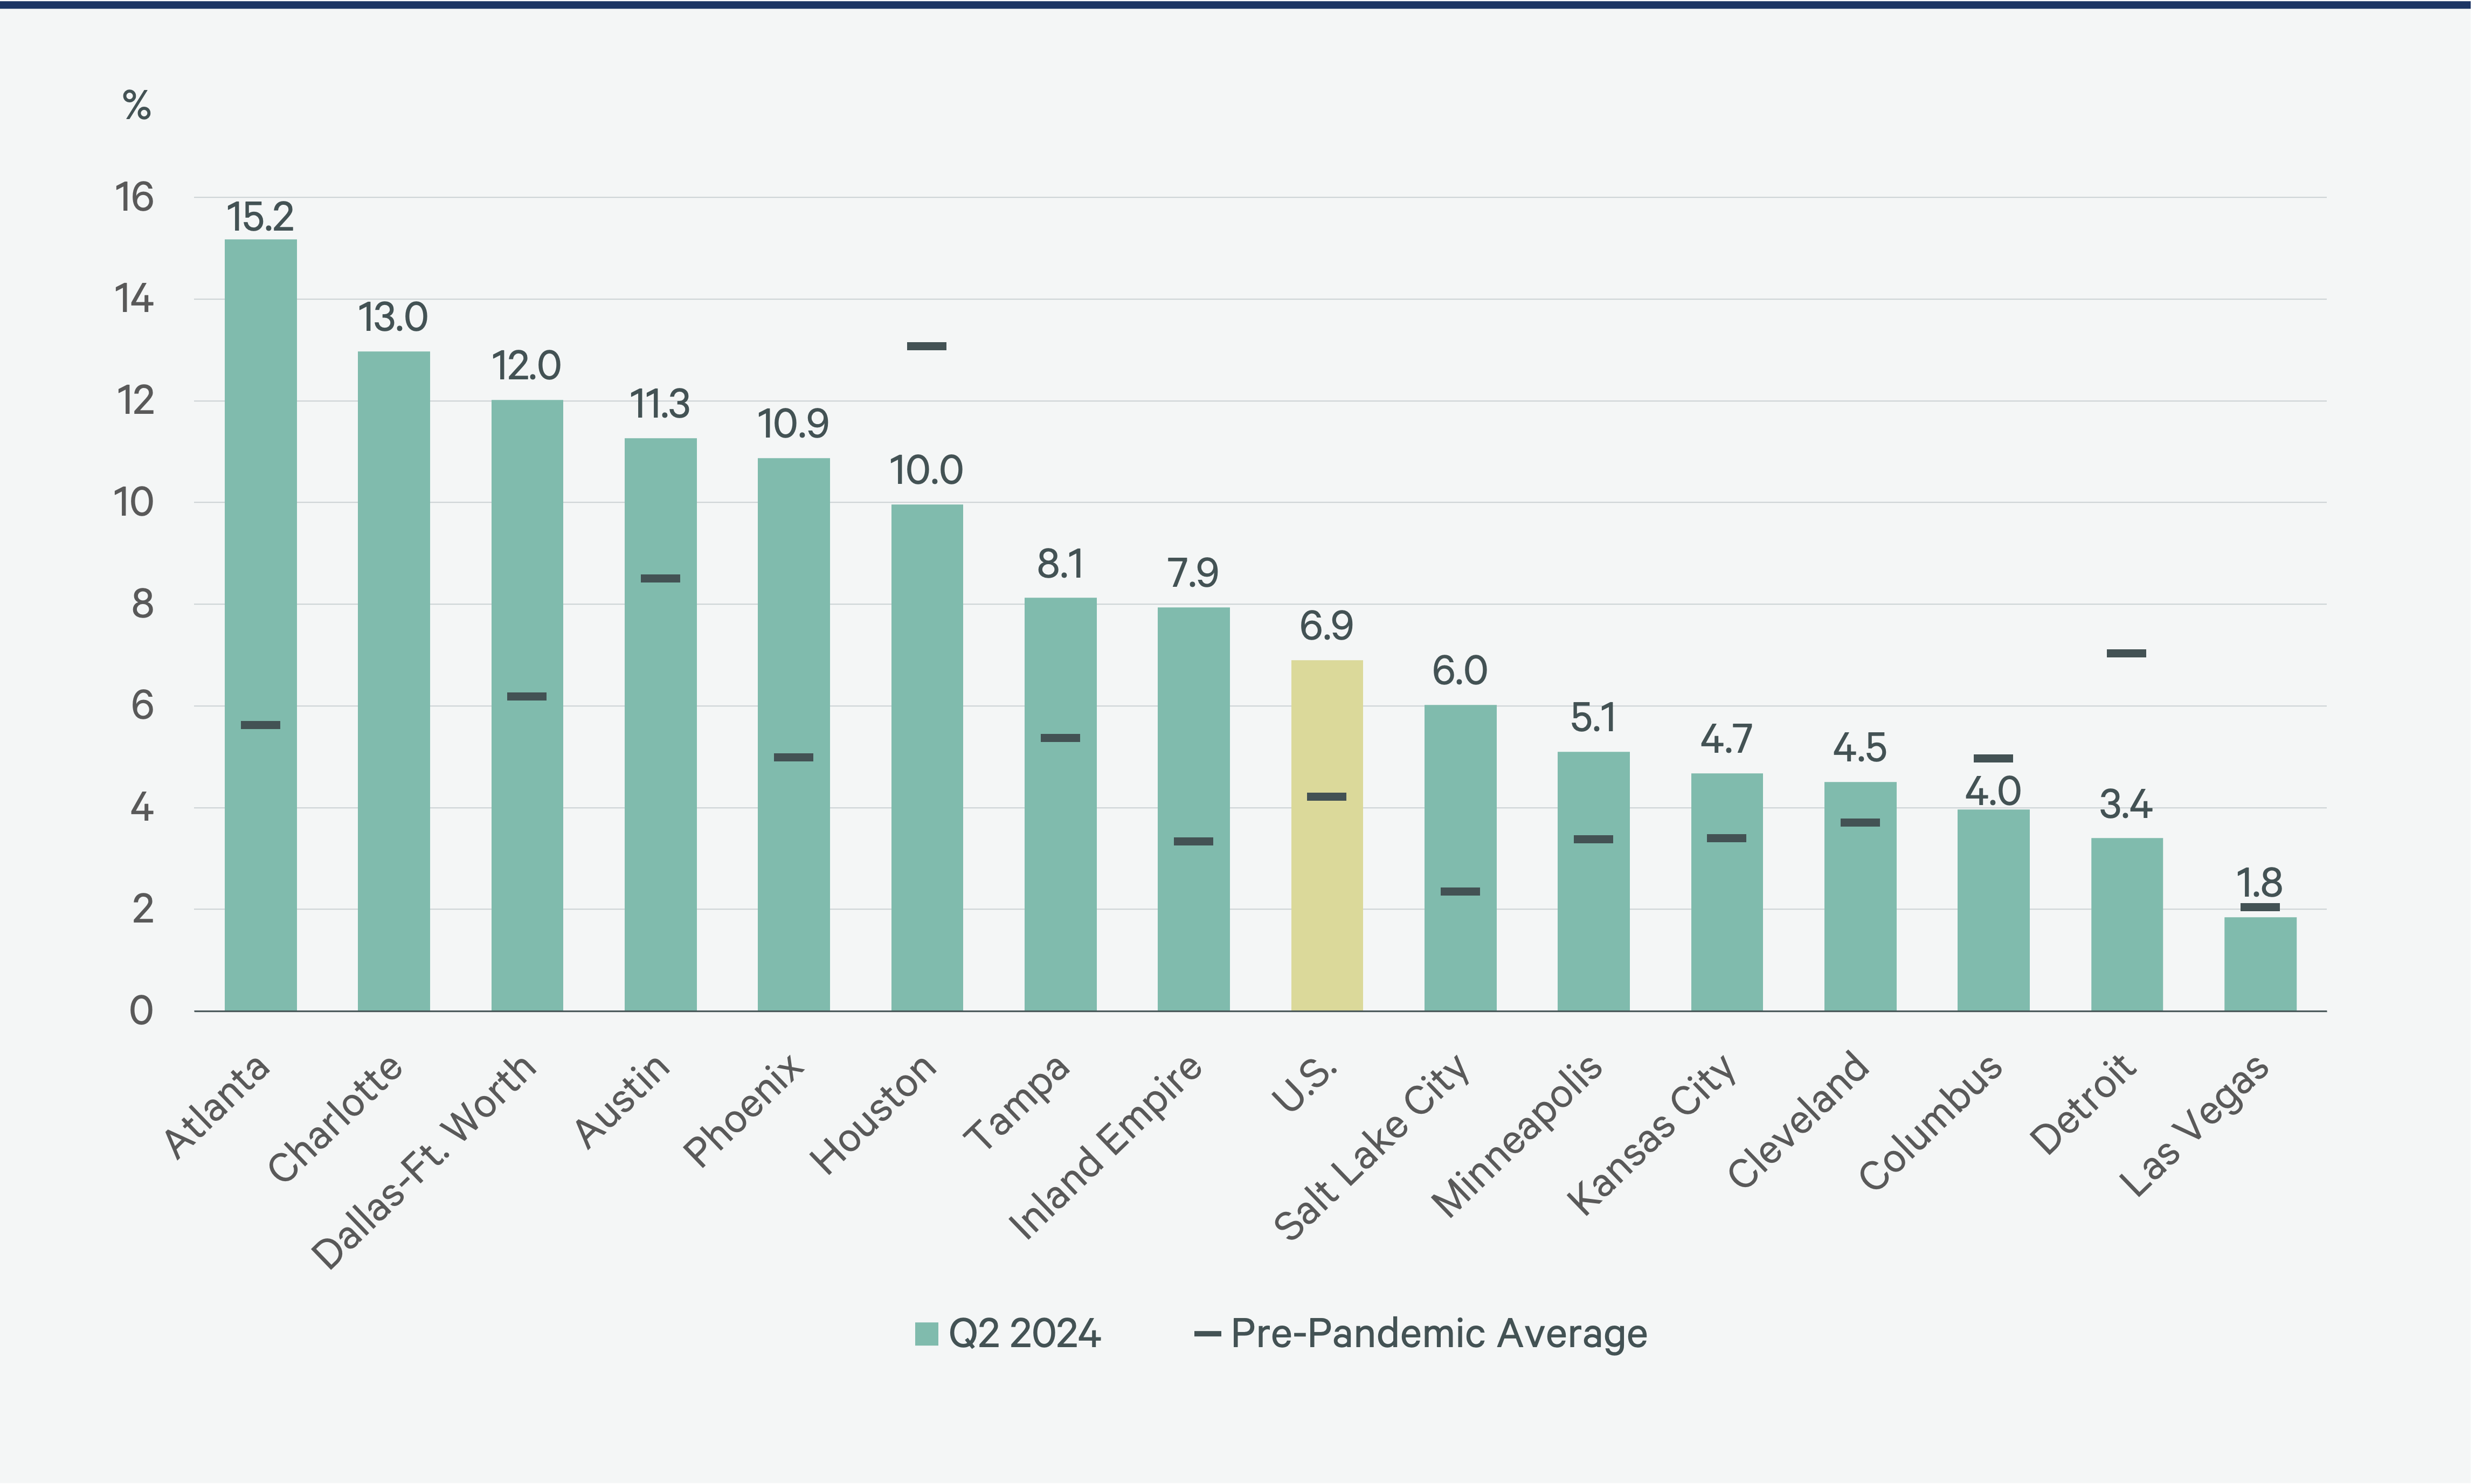
Select Market Vacancy Rates Compared With Pre-Pandemic Averages
BTR vacancy rates remain elevated relative to pre-pandemic averages for nearly all of the nation’s largest BTR markets. As the wave of new BTR supply is absorbed, vacancy rates are expected to fall more in line with their long-term averages.
Figure 18
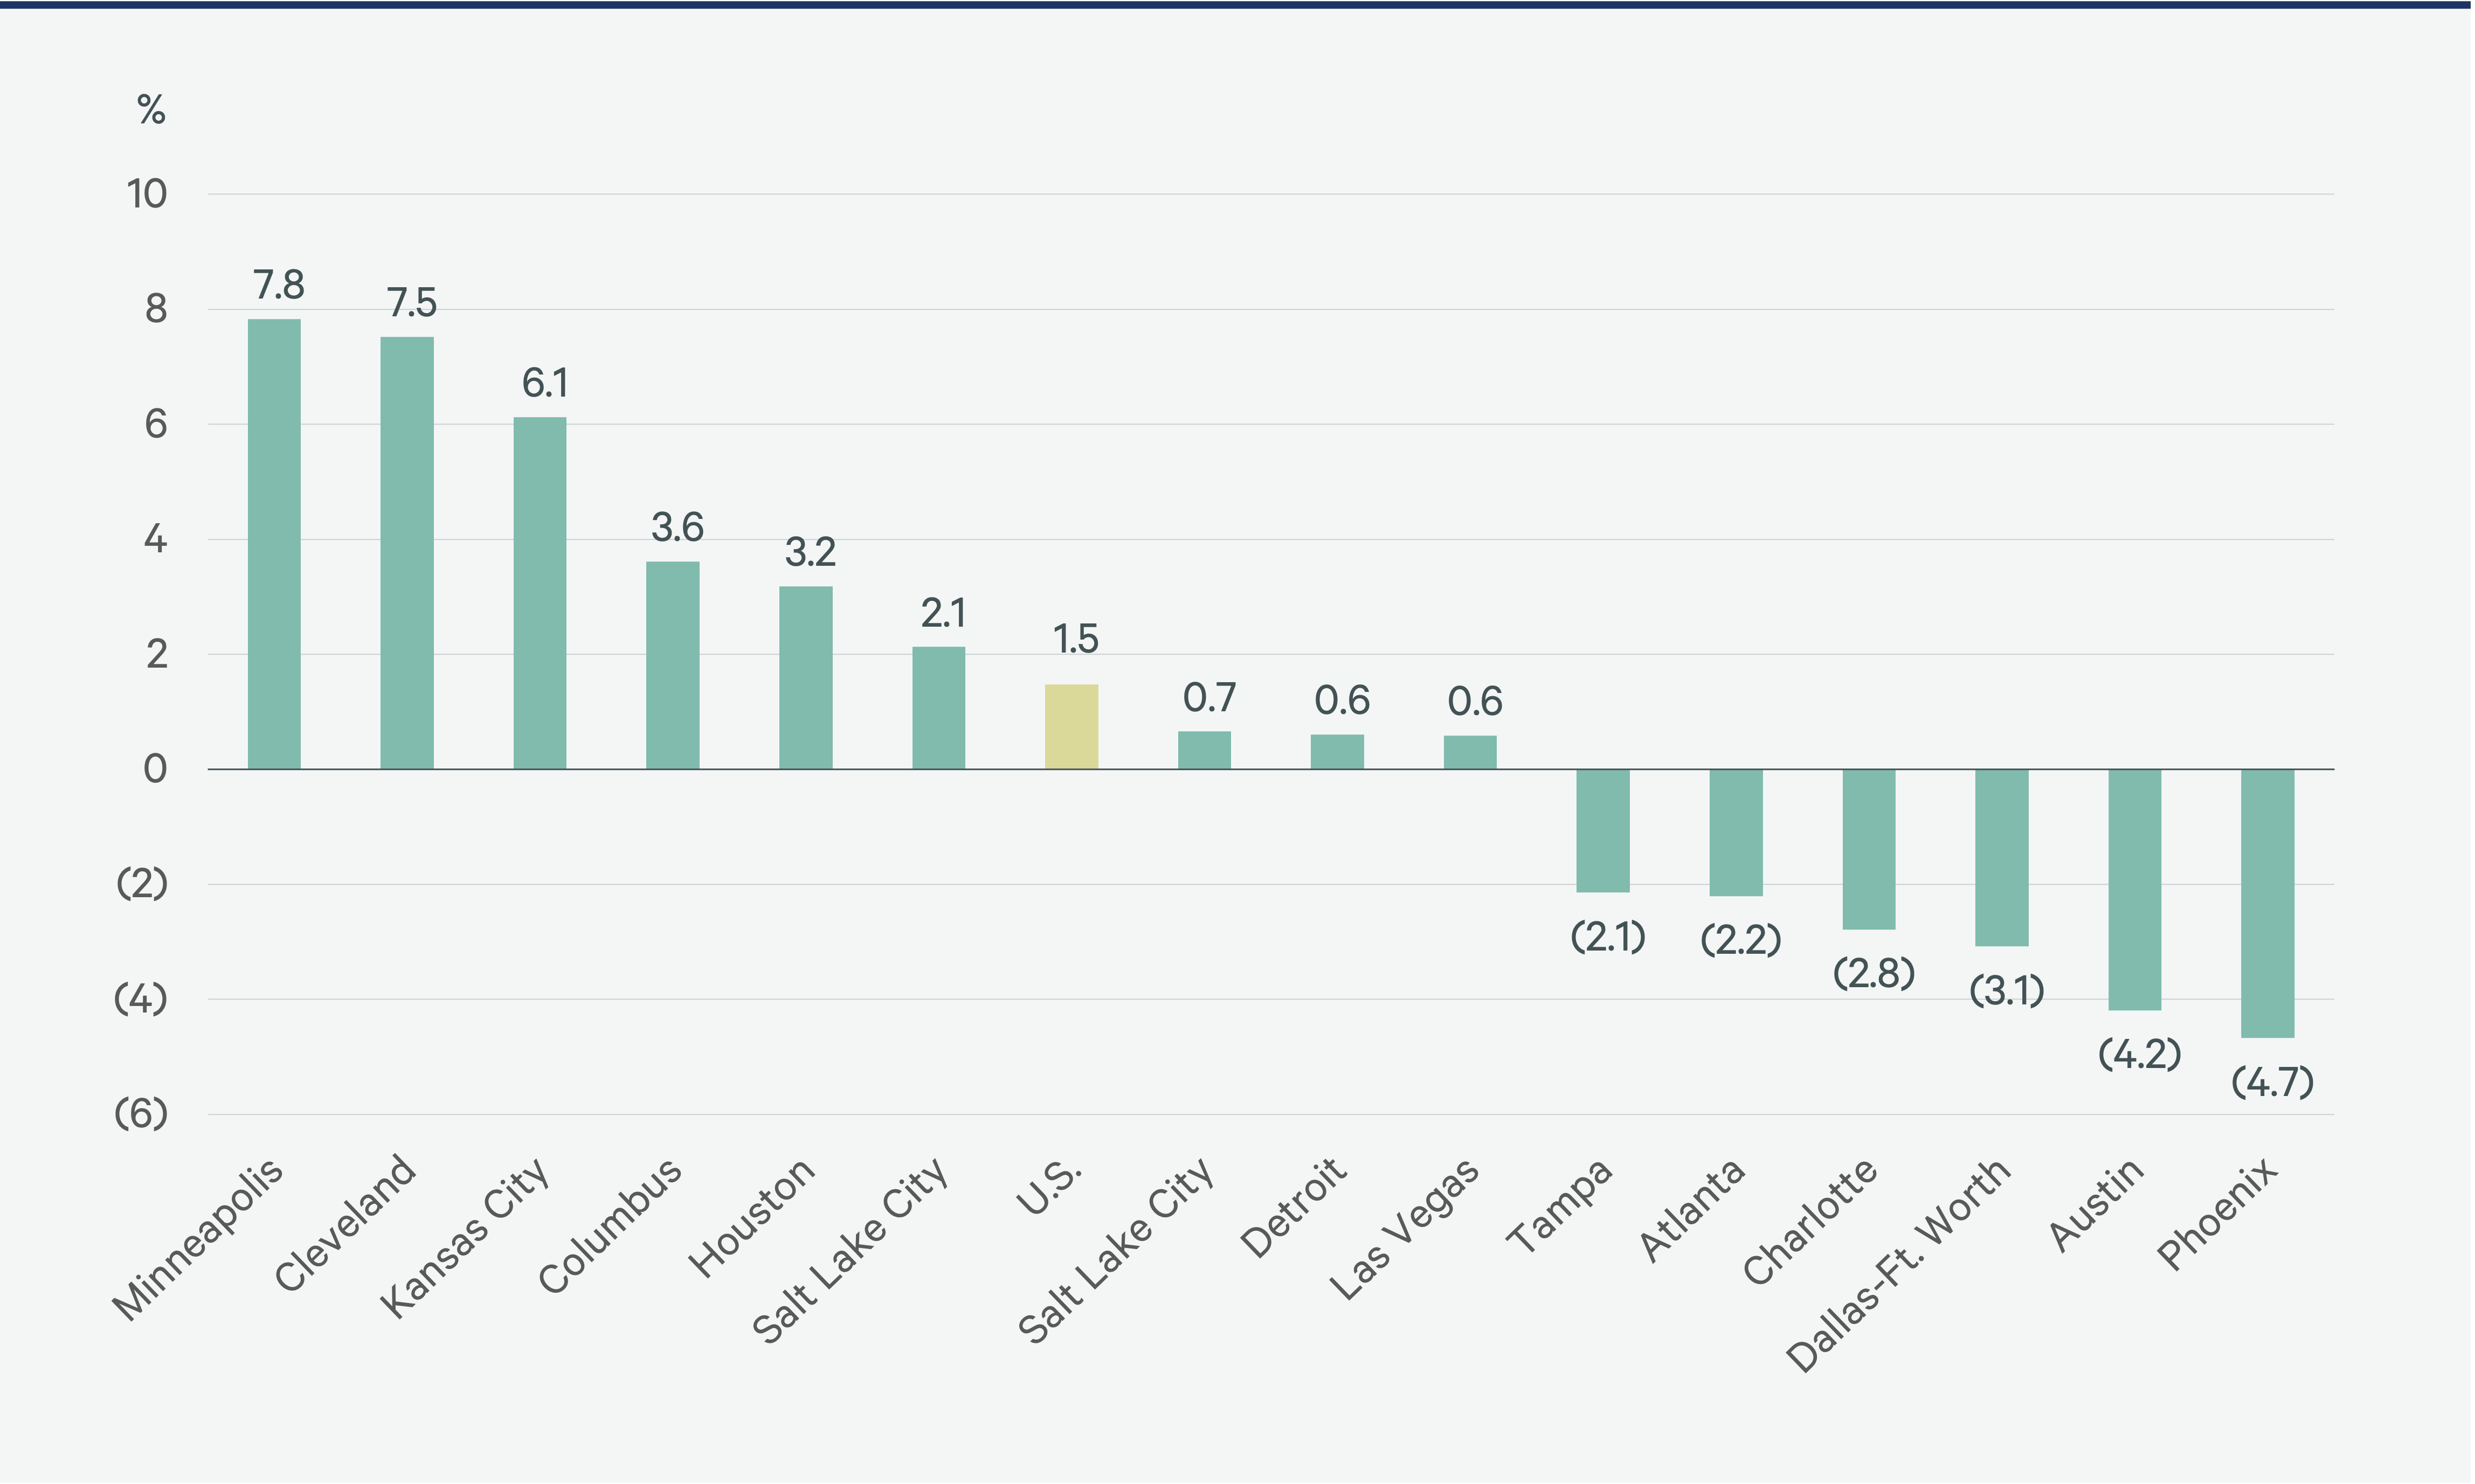
Annual Rent Growth for Largest BTR Markets, Q2 2024
Markets with the smallest construction pipelines and lowest vacancy rates are achieving the most rent growth. The Midwest leads the way in this regard with markets such as Minneapolis, Cleveland and Kansas City all achieving rent growth significantly higher than the 1.5% national average.
Figure 19
Investing in BTR
Institutional Activity & Major Joint Ventures
Four Principal Ways to Invest in BTR
SFR Market
Most of the 23 million SFR homes in the U.S. are owned by mom-and-pop investors. While institutional investors have started entering the market, they account for less than 2% of SFR ownership. Some investors focus on Scattered SFR but most prefer the more natural strategy of entering the SFR market via BTR communities.
SFR REITs, which outperformed the REIT Index between 2019 and 2021, have helped to introduce institutional investors to the market.
Figure 20: Top Five Institutional SFR Owner-Managers

Institutional Investors Emerge in BTR
A small number of well-capitalized private equity investors began assembling large scattered SFR portfolios during the Global Financial Crisis. Operational efficiencies are not inherent for portfolios of scattered assets. However, consumer demand for SFR was evident and led to outsized investment performance. The growth of BTR assets over the past five years has contributed to broader institutional investor interest in SFR.
BTR’s ability to offer a differentiated product with traditional multifamily operating features makes it a logical addition to institutional investor portfolios. Attractive rent growth and operational efficiencies have led to strong institutional investor interest in BTR. Additionally, BTR has the exit optionality of continuing to operate as a rental community or selling to individual homebuyers.
CBRE expects that domestic and global institutional capital targeting BTR assets will accelerate in coming years.

BTR Market Opportunities
Because it is in the early stage of growth, the BTR sector presents many opportunities for investors. Among the many factors driving rent growth are:
- A national housing shortage.
- A surge of millennials creating families and leaving traditional apartments.
- Downsizing by baby boomers, with some choosing the flexibility and low-maintenance lifestyle of renting.
- Increased housing demand in suburbs and exurbs due to remote work trends.
- Limited BTR supply, exacerbated by a constrained construction lending environment and property entitlement challenges in many locations
Opportunities
LP Equity: Equity investments for new development are highly demanded by builders and developers, enabling limited partners (LP) to negotiate competitive terms. Both equity providers and developers often seek strategic relationships for ongoing partnerships, not just to capitalize one deal. Similarly, LP equity providers will find compelling opportunities for recapitalizing assets and portfolios at stabilization or with forward takeouts.
Construction Financing: Lenders are currently more selective in funding new development due to banking sector pressures and fewer loan payoffs than expected. Current constrained lending conditions are favorable for lenders seeking deals and long-term borrower relationships with BTR developers.
Acquisitions: Investors will see more stabilized property deal flow as more inventory is delivered and if interest rates moderate as expected. At present, investors should consider focusing on stabilized offerings, since deal flow will likely be modest over the next 12-24 months.
Related Service
- Property Types
Build-to-Rent
We answer the growing call for build-to-rent housing with expert solutions that support the success of owners and developers as well as buyers, lender...
Contacts
Asher C. Gunter
Vice Chairman, Managing Director – Southwest Region

Bryan Barnett, MAI
VAS Executive Vice President


