Intelligent Investment
A Unique Opportunity for Trophy Office Development
Prime, or Class A+, office space has been outperforming other classes of office space since the beginning of the COVID-19 pandemic.
April 9, 2024 7 Minute Read

Executive Summary
Receive EA Insights Directly in your Inbox
Prime, or Class A+, office space is outperforming the other classes of office space nationwide in terms of rent growth, rent levels, and vacancy rates, and has been doing so since the beginning of the COVID-19 pandemic.
CBRE Econometric Advisors (CBRE EA) has recently released a prime office aggregated quarterly historical time series with fundamentals on prime office properties (top 2-4% of office buildings) as categorized in collaboration with CBRE professionals.
CBRE EA utilizes this data to compare the attractiveness of developing top-quality office space across 16 markets.
Miami and Boston are the most attractive when considering the amount of inventory that is prime, cost-to-rent ratio, and prime vacancy rates.
Introduction
Recent research from CBRE EA explored the much-discussed flight-to-quality phenomenon occurring within the office sector. The growth in vacant space from Q1 2020 to Q2 2022 was entirely driven by the 10% of hardest hit buildings. In fact, excluding the bottom 10% of properties that experienced the most vacant square footage increase, net absorption has been positive since 2020. Interestingly, 70% of the hardest hit buildings were Class A-, and generally built during the building boom of the 1980s and 1990s. While tenants are flocking to quality space, Class A- buildings (more so than the lowest tier of space) are bearing the brunt of current market turmoil.
While office vacancy is rising and effective rents are falling, prime properties have dramatically outperformed. These properties have maintained stable occupancy and command rents well above their market average. Given the strong demand for the “best” space available, we believe any newly delivered best-in-market office property would peel away existing tenants in the market and lease up rapidly. The viability of such a construction project depends on several key factors: market rent, percentage premium of prime rents over the average, construction costs and length, lease-up length, and terminal value, to name a few.

Given the potential for dramatic outperformance, we conducted an analysis which ranks the attractiveness of new best-in-class office developments in several CBRE EA Tier 1 markets along different dimensions. We begin with a property-level dataset with key information including location, asking rent, vacancy, year of construction and prime status. Our analysis is restricted to 16 markets where CBRE EA, leveraging local experts, has identified prime properties.
Prime Properties Across Office Markets
Building Level Data
Our primary dataset is a CBRE EA tracked cross-section of office properties including average asking rent, year built and location. For the markets in our analysis, we leverage CBRE real estate professionals’ local expertise on which properties are considered prime. We merge this list of prime properties into our building level dataset to classify each property as prime vs. non-prime.
Figure 1 presents total inventory by prime status as well as the number of individual properties identified as prime in each market.
Figure 1: Inventory by Prime Status
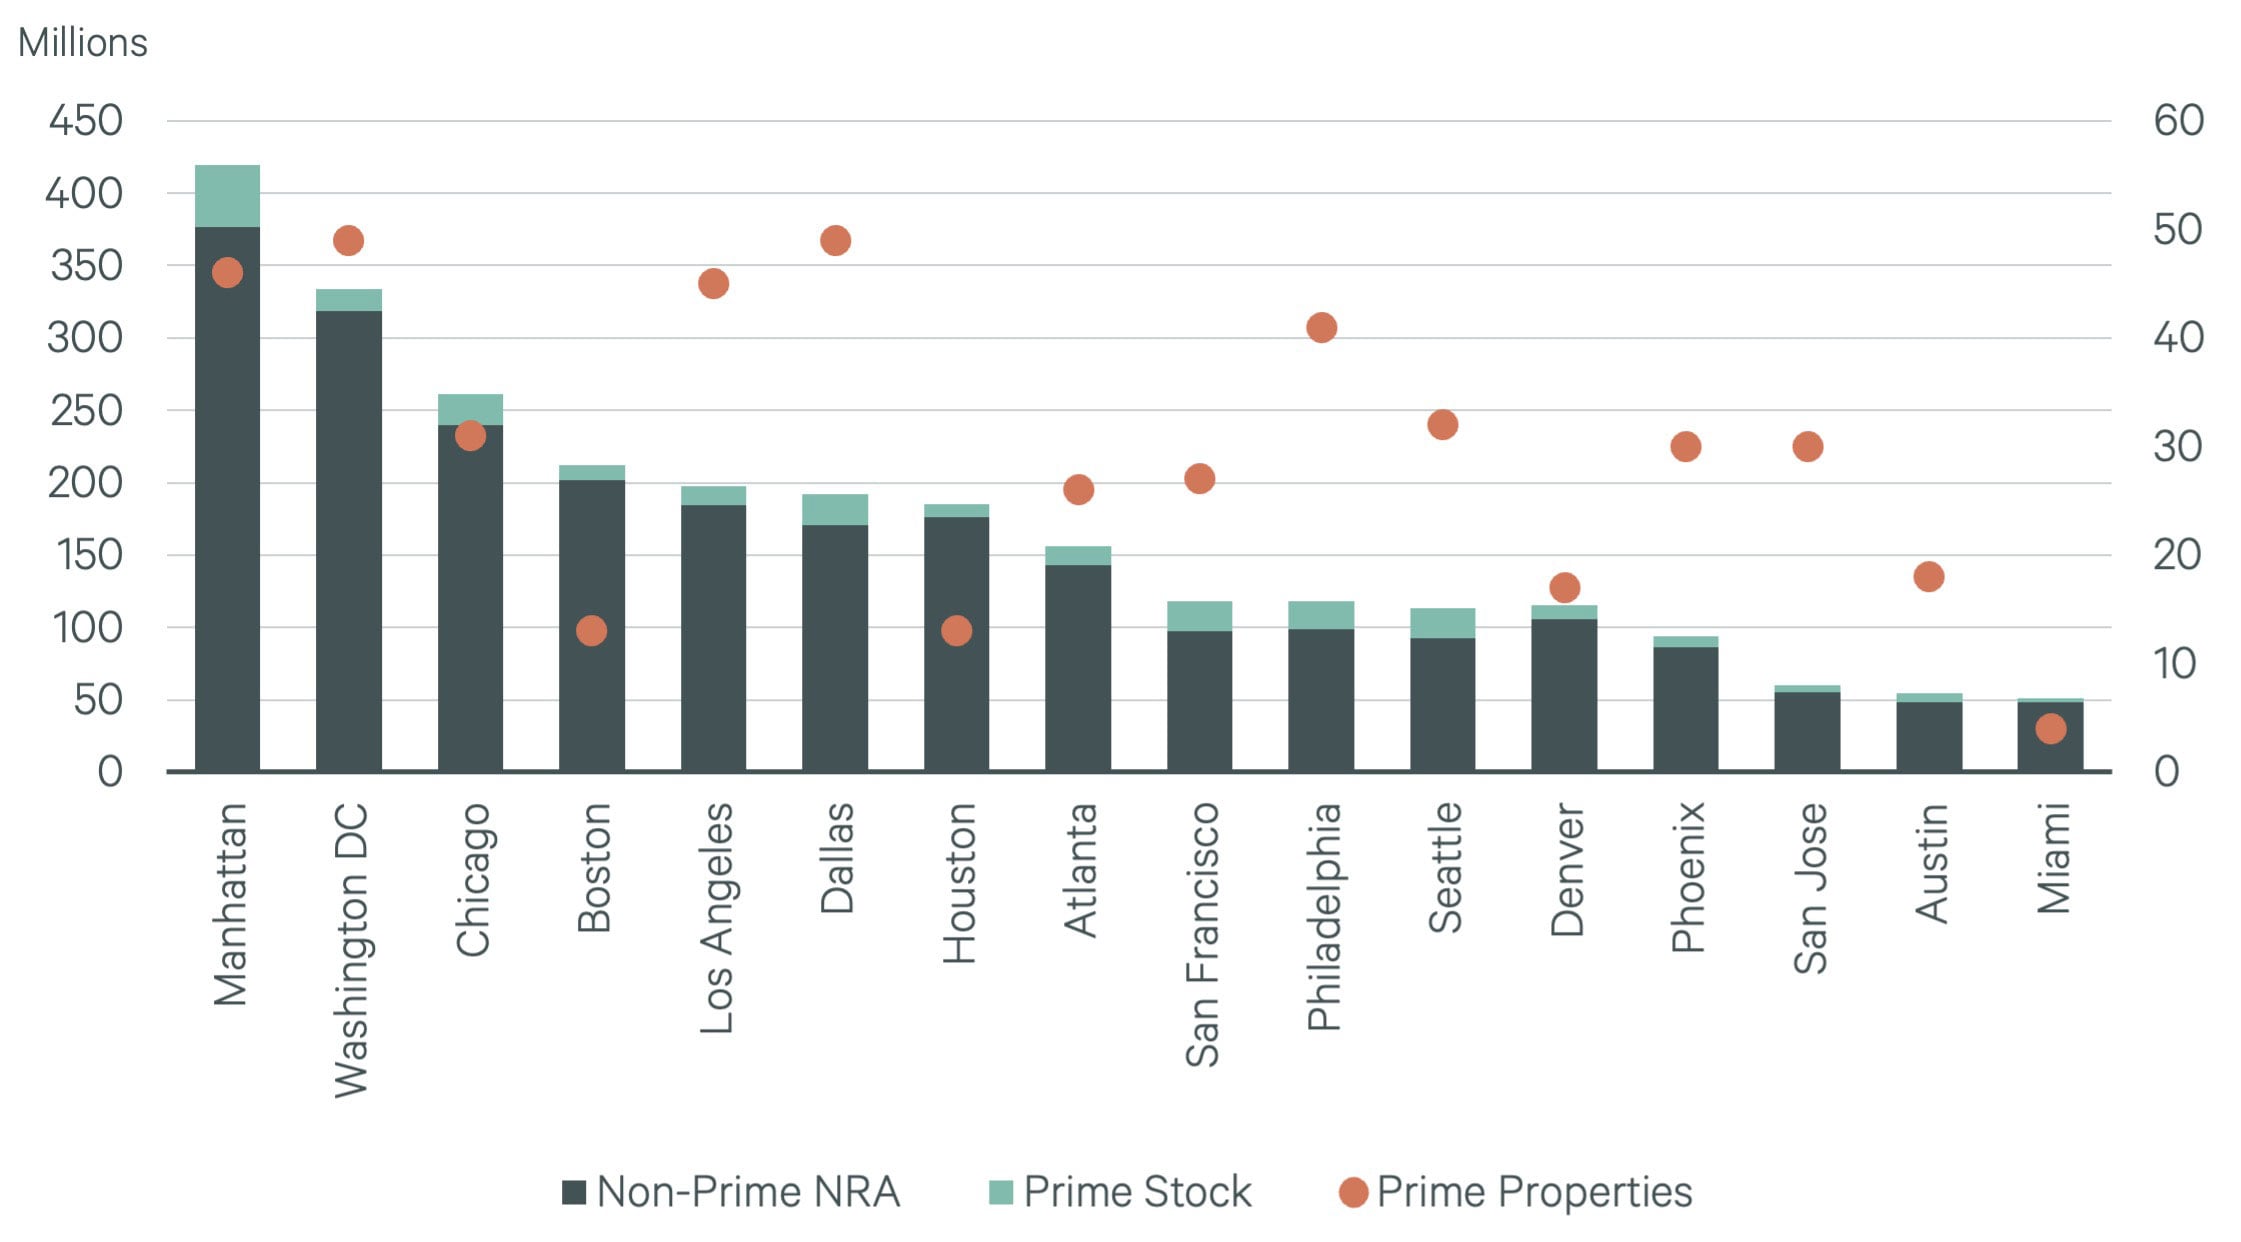
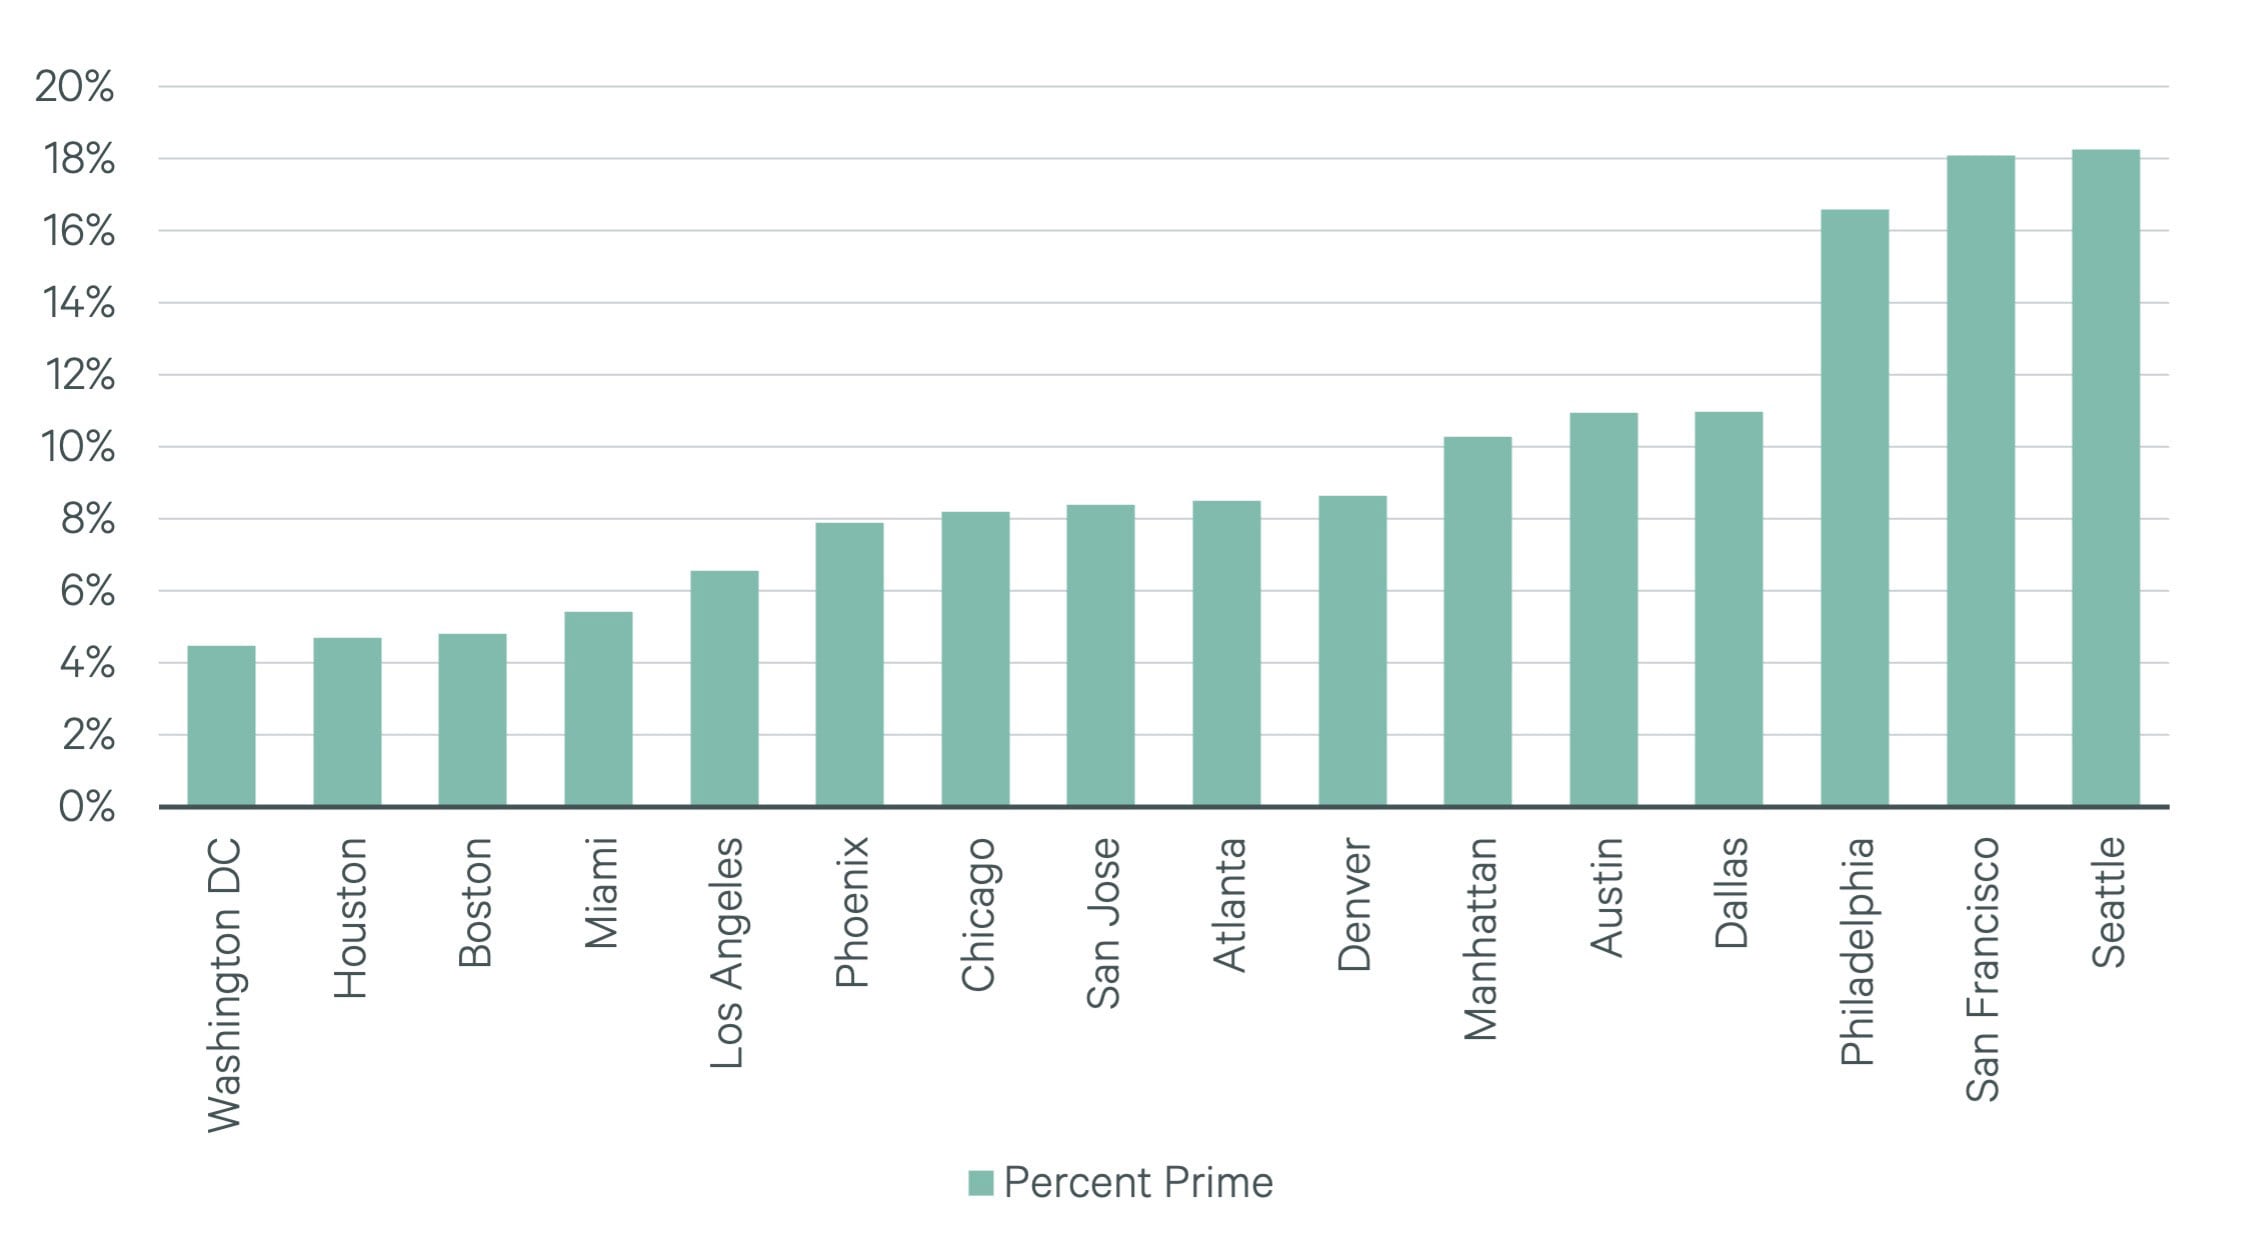
The fraction of a market made up of prime space is an important variable in determining attractiveness of development. In Figure 2, we rank each of our markets in order of highest to lowest fraction prime. Markets with a low fraction of prime space, such as Boston or Miami, may be good candidates for new development due to relatively fewer competitors for top tenants. Markets such as Seattle, with a high fraction of prime space already, may be over served.
Figure 2: Prime Inventory Fraction
In most markets, prime buildings have lower vacancy, higher rent, and are built more recently compared with the market average. These trends are reflected in our selection of EA markets in figures 3-5.
Figure 3 reflects the weighted average vacancy rate as of Q4 2023 by market for prime properties versus the overall office market. Markets to the right of the red line are those for which prime properties have lower vacancy rates than average. Miami, Washington D.C., Chicago, Philadelphia and Boston have the lowest prime vacancy relative to market vacancy.
Prime properties are not outperforming in every market. For instance, Austin, Seattle and Phoenix have a prime vacancy rate above the market average. Some of this is driven by newly built prime buildings still leasing up. Austin has more headwinds from supply, and some of the new buildings are not in the most sought-after submarkets, leaving them relatively vacant. In other cases, this is driven by an imbalance of supply and demand for prime assets in the given market. Seattle has limited demand for prime space because tech firms, the main demand driver, prefer to get people back to their own campus and are not actively leasing. Meanwhile, many financial and law firms already have leases in multi-tenant prime spaces and are not actively moving to other prime spaces.
Figure 3: Market Vacancy vs. Prime Vacancy
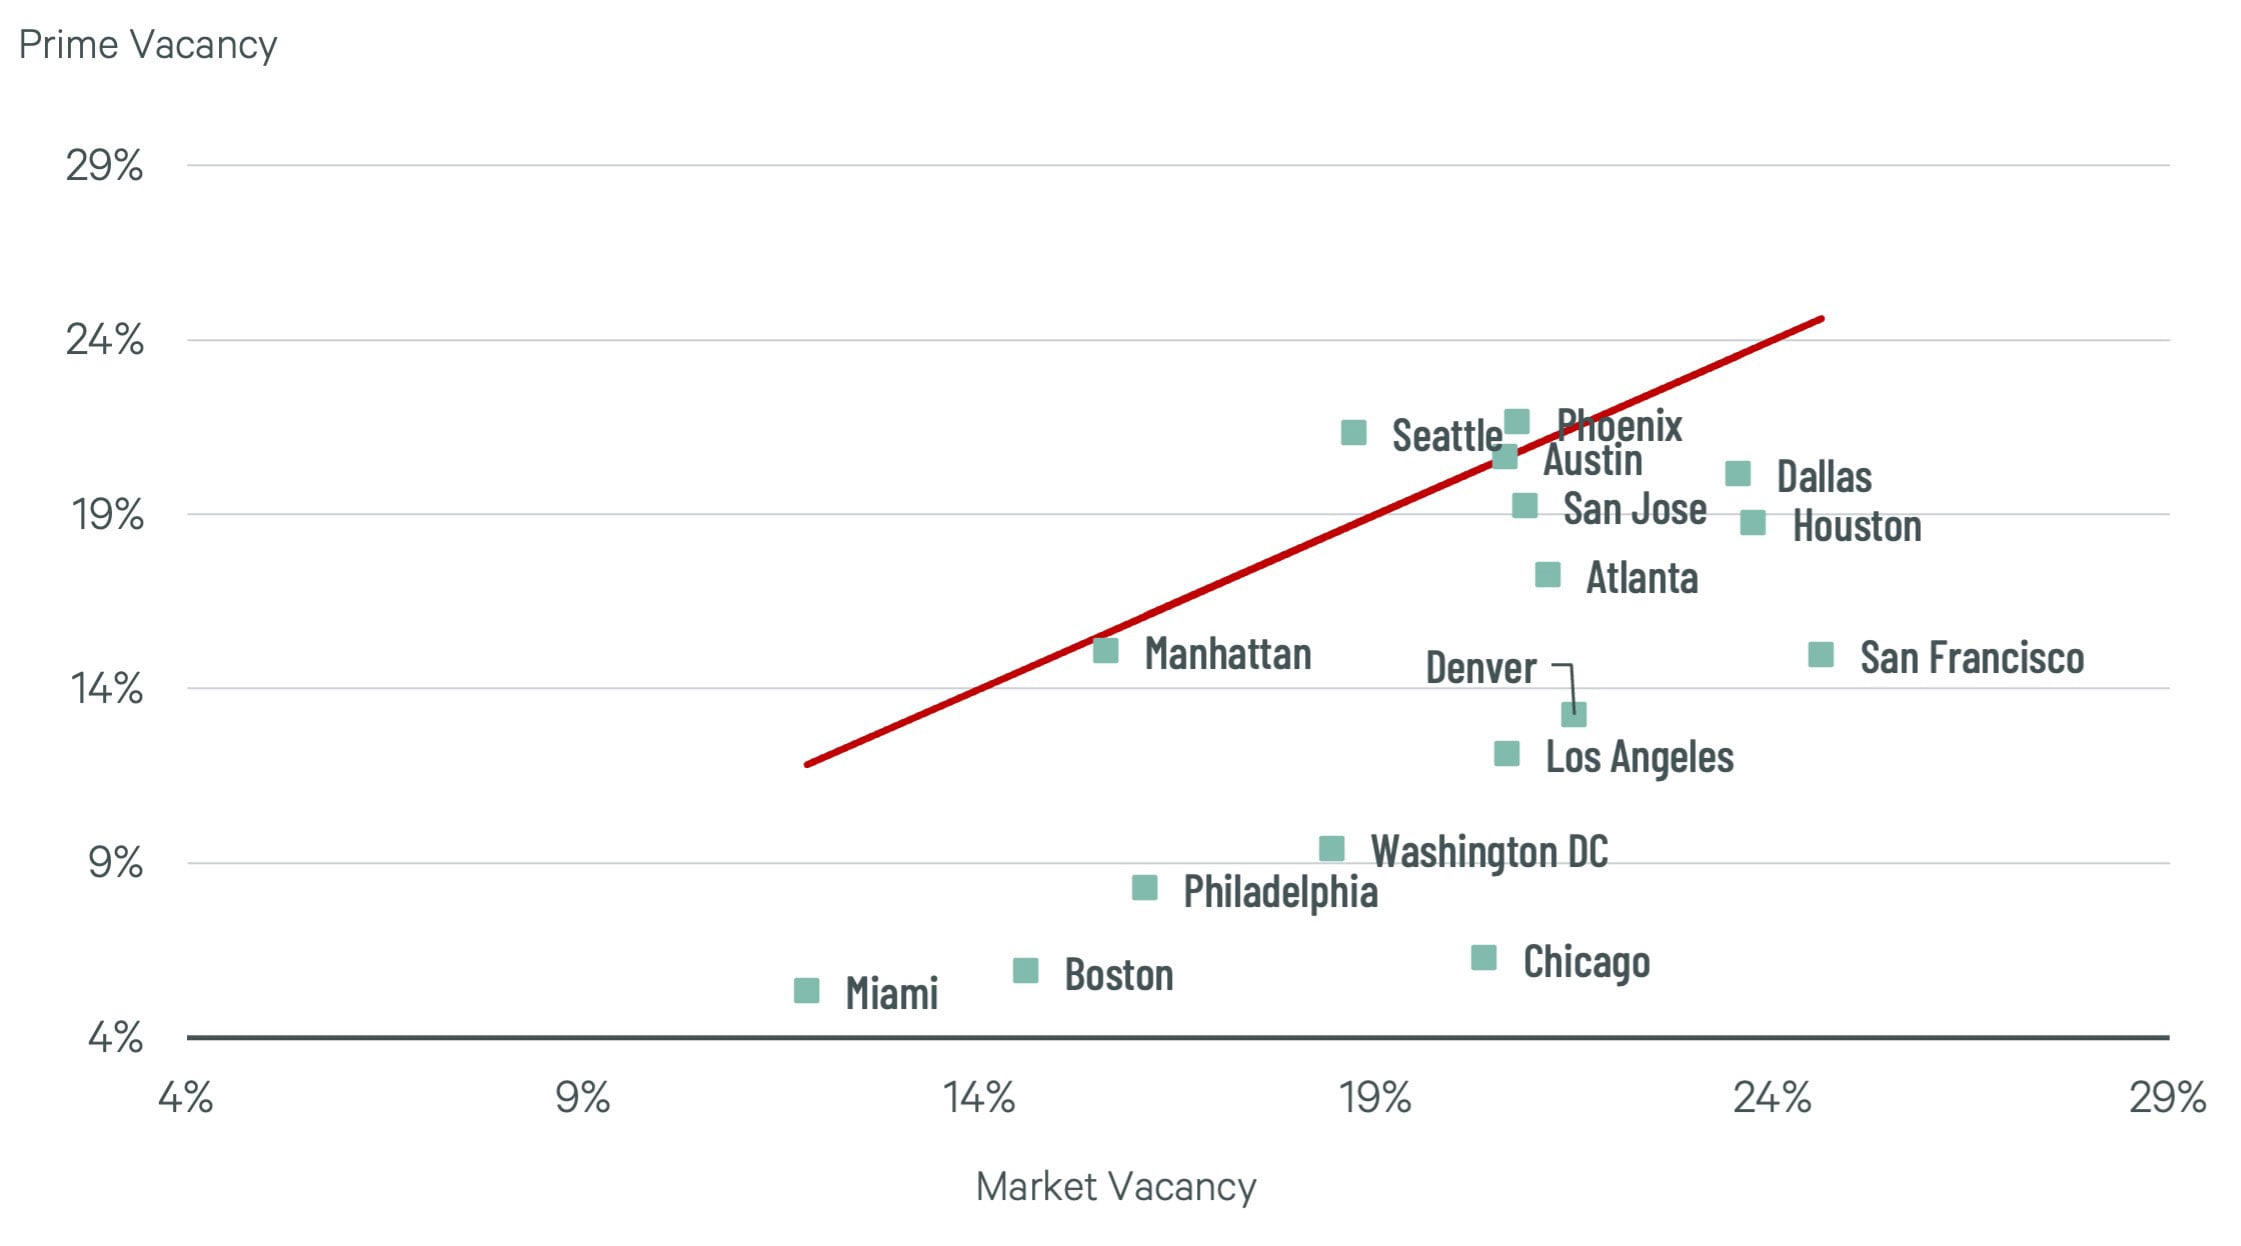
Figure 4 reflects the weighted average asking rent by market for prime properties versus the overall office market. Markets furthest to the left of the red line have the largest rent premium for prime buildings. San Francisco, our third most expensive market, has a relatively meager premium of only 7%. Manhattan, our most expensive market by far, has a substantial rent premium of 73% for prime properties. On a percentage basis, the premium is highest in Miami, Los Angeles, Houston, Manhattan and Boston.
Prime rent is an important variable when deciding whether to develop prime space. The higher rents these trophy buildings command justifies the higher cost of creating a highly amenitized building. And as noted in Figure 3, prime buildings are generally less exposed to vacancy pressures. This should help these properties avoid the downward pressure on net effective rents the office sector has faced since 2020.
Figure 4: Market Rent vs. Prime Rent
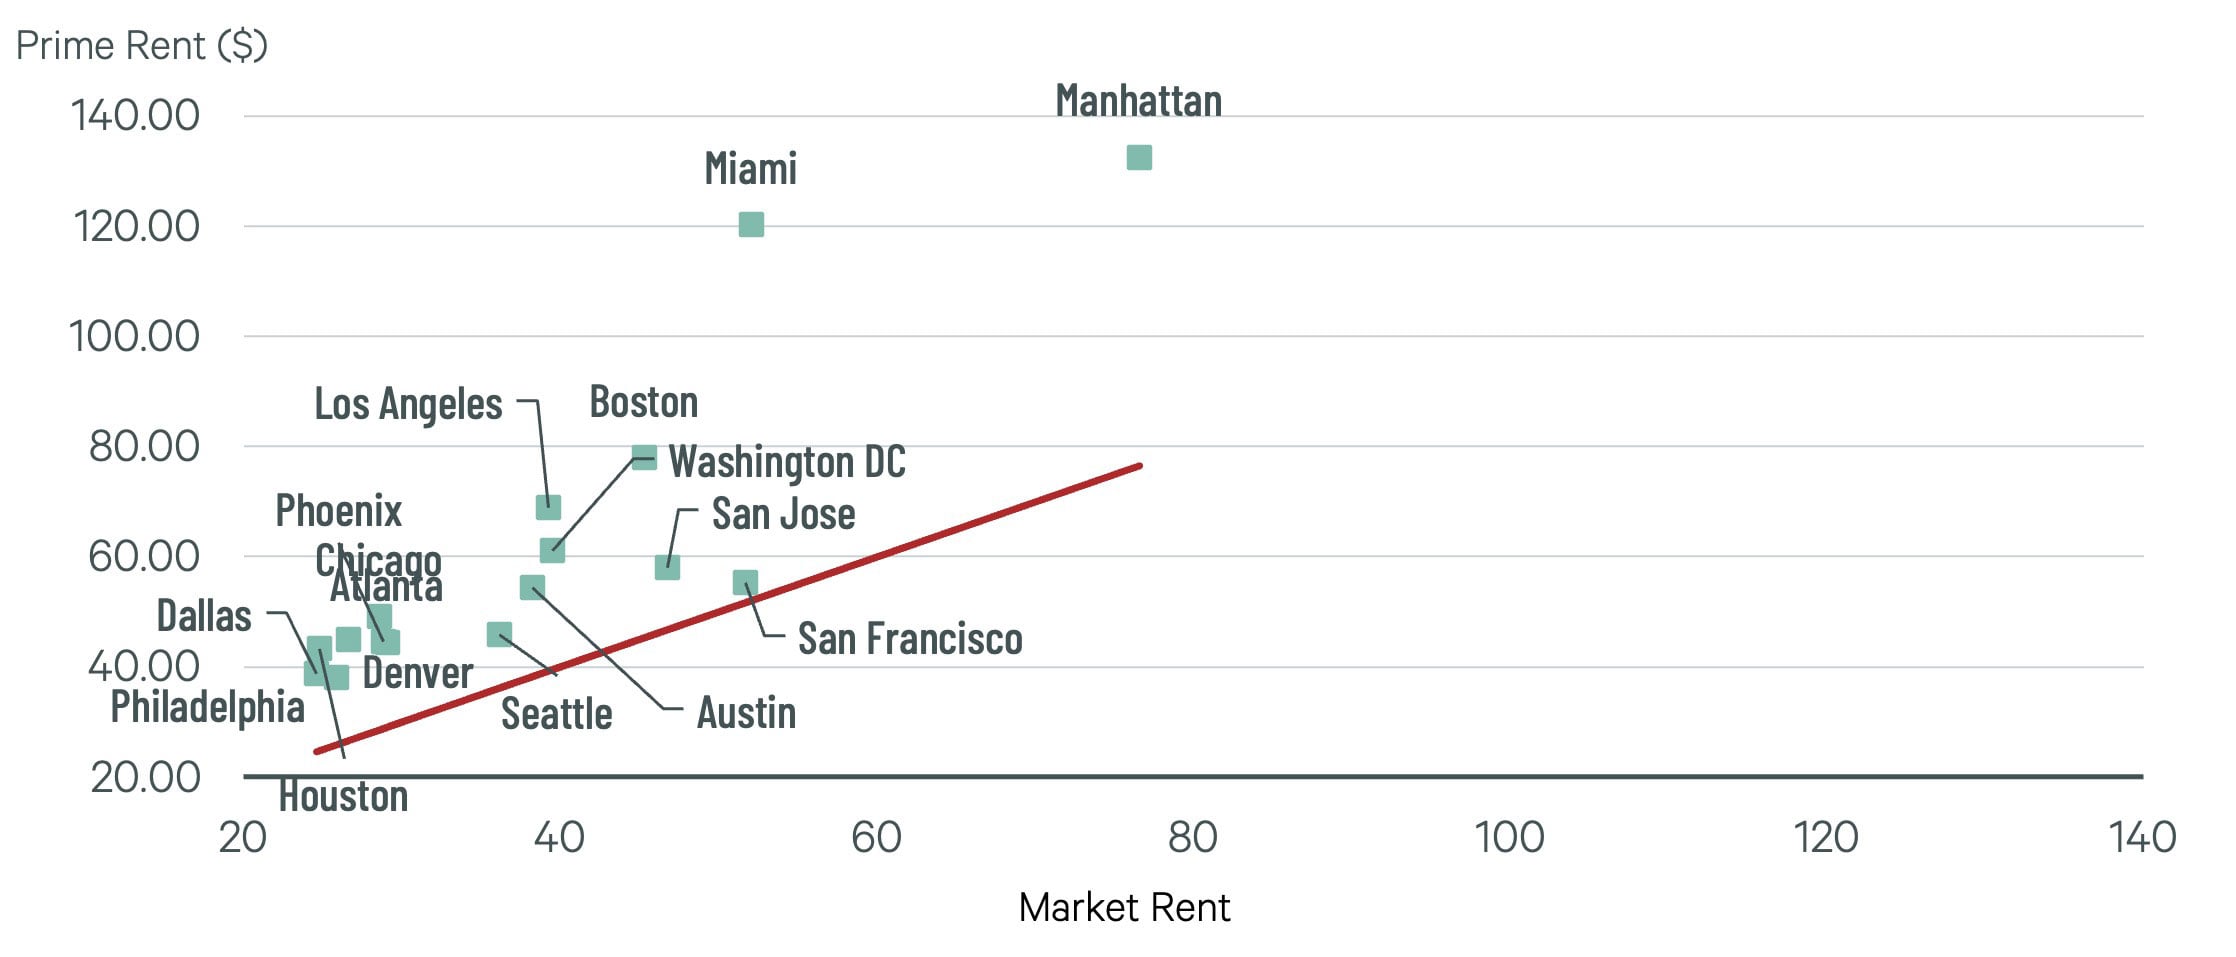
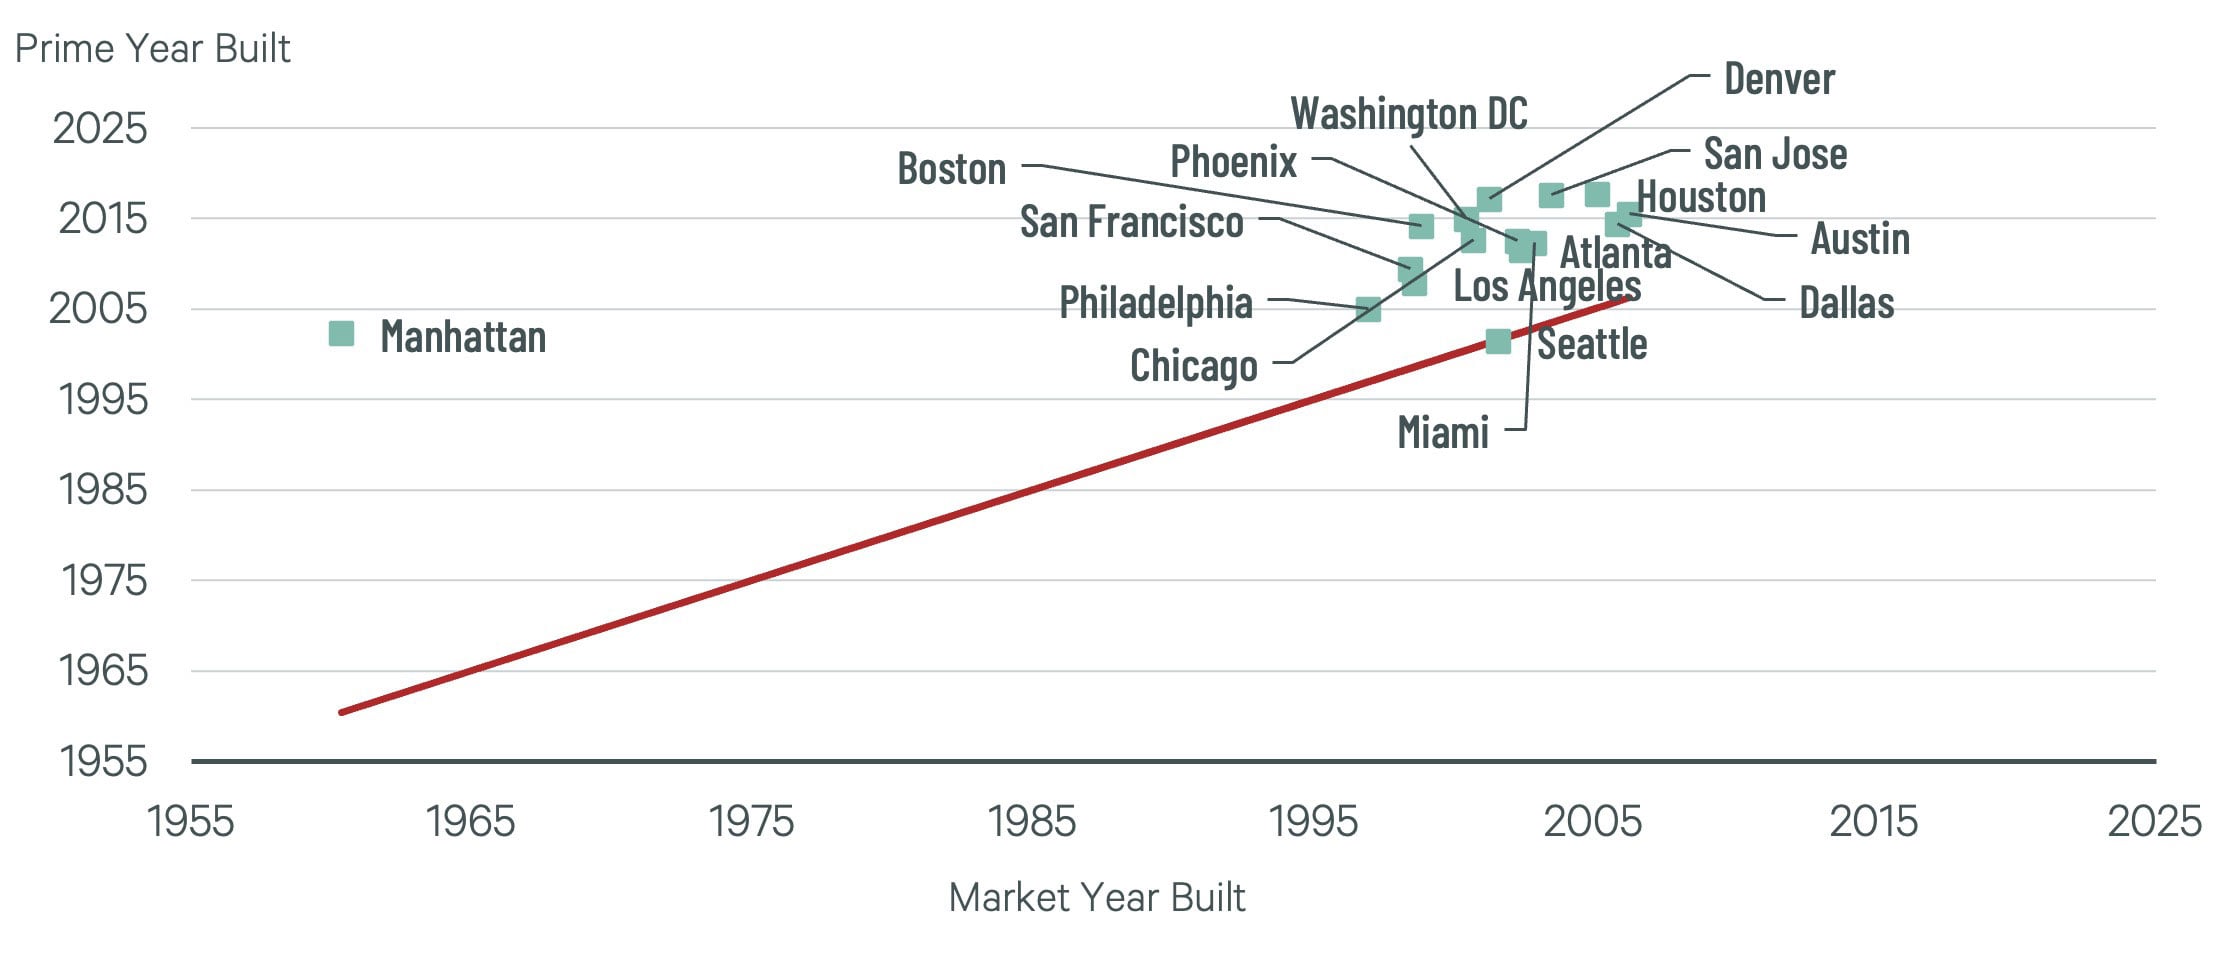
Figure 5 reflects the weighted average year built/renovated by market for prime properties versus the overall office market. In some markets, the overall stock is notably older while the prime stock is newer, suggesting there is already newly built best-in-class space. Manhattan is one example. On the other hand, markets like Seattle have very little difference in the average age between prime and non-prime buildings. Although an aging prime stock may provide an opportunity to create new best-in-class space, this may not be the case everywhere. In fact, sometimes an older building may be historically important or iconic. In other cases, older well-maintained prime office properties are near important locations and loved by professional tenants.
Figure 5: Market Year Built vs. Prime Year Built
Construction Costs
In addition to falling net operating income and higher cap rates, the office sector faces dramatically increased construction costs. In fact, from Q1 2020 to Q4 2023 national average office construction costs have grown by 25.2% according to the CBRE Construction Cost Index, an index that measures changes in the cost of construction by sector at a quarterly level. Indeed, given the change in general office demand in conjunction with these cost hikes, most office buildings built in recent years would not pencil out today. While building a prime building with in-demand amenities costs more than the average property, they may be the only office asset worth building.
One Vanderbilt Tower, a 93-story skyscraper in midtown Manhattan which we view as a representative of best-in-class space in the most expensive construction market, opened its doors in 2020. According to the developer, construction cost $1,732 per sq. ft. After applying the growth in the CBRE Construction Cost Index, our 2024 cost is $2,192 per sq. ft. We view this as an upper limit on cost.
To estimate the comparable cost of construction in other markets, we utilize an additional data source. RS Means provides an index of many U.S. cities against the national average construction cost. We use the index value of New York City (NYC) as our baseline as it is closest to Manhattan. For each market, we measure the cost difference as the quotient of their index value and the NYC index value.1 We reduce our $2,192 per sq. ft. by this cost difference and produce a cost per sq. ft. estimate for all other markets.
Cost in City X = $2,192 ∗ City X Cost Index/NYC Cost Index
Our cost estimates per sq. ft. as well as an index of prime asking rents as a ratio of it are presented in Figure 6. This ratio is an important variable for market selection as it indicates how quickly the developer can expect to recoup their outlay. Since we are scaling down the cost of the best building, we use the 95th percentile of prime rents in each market to capture the highest rents in each market. These are relative figures and not comparable to an actual yield due to the fact we do not know exactly what an equivalent One Vanderbilt Tower would rent for in each market. Despite the highest costs, Manhattan has the most favorable rent-to-cost ratio, followed by Miami. Among our markets, Boston has the third best cost ratio while Philadelphia stands out with the worst ratio.
Figure 6: Prime Construction Cost by Market
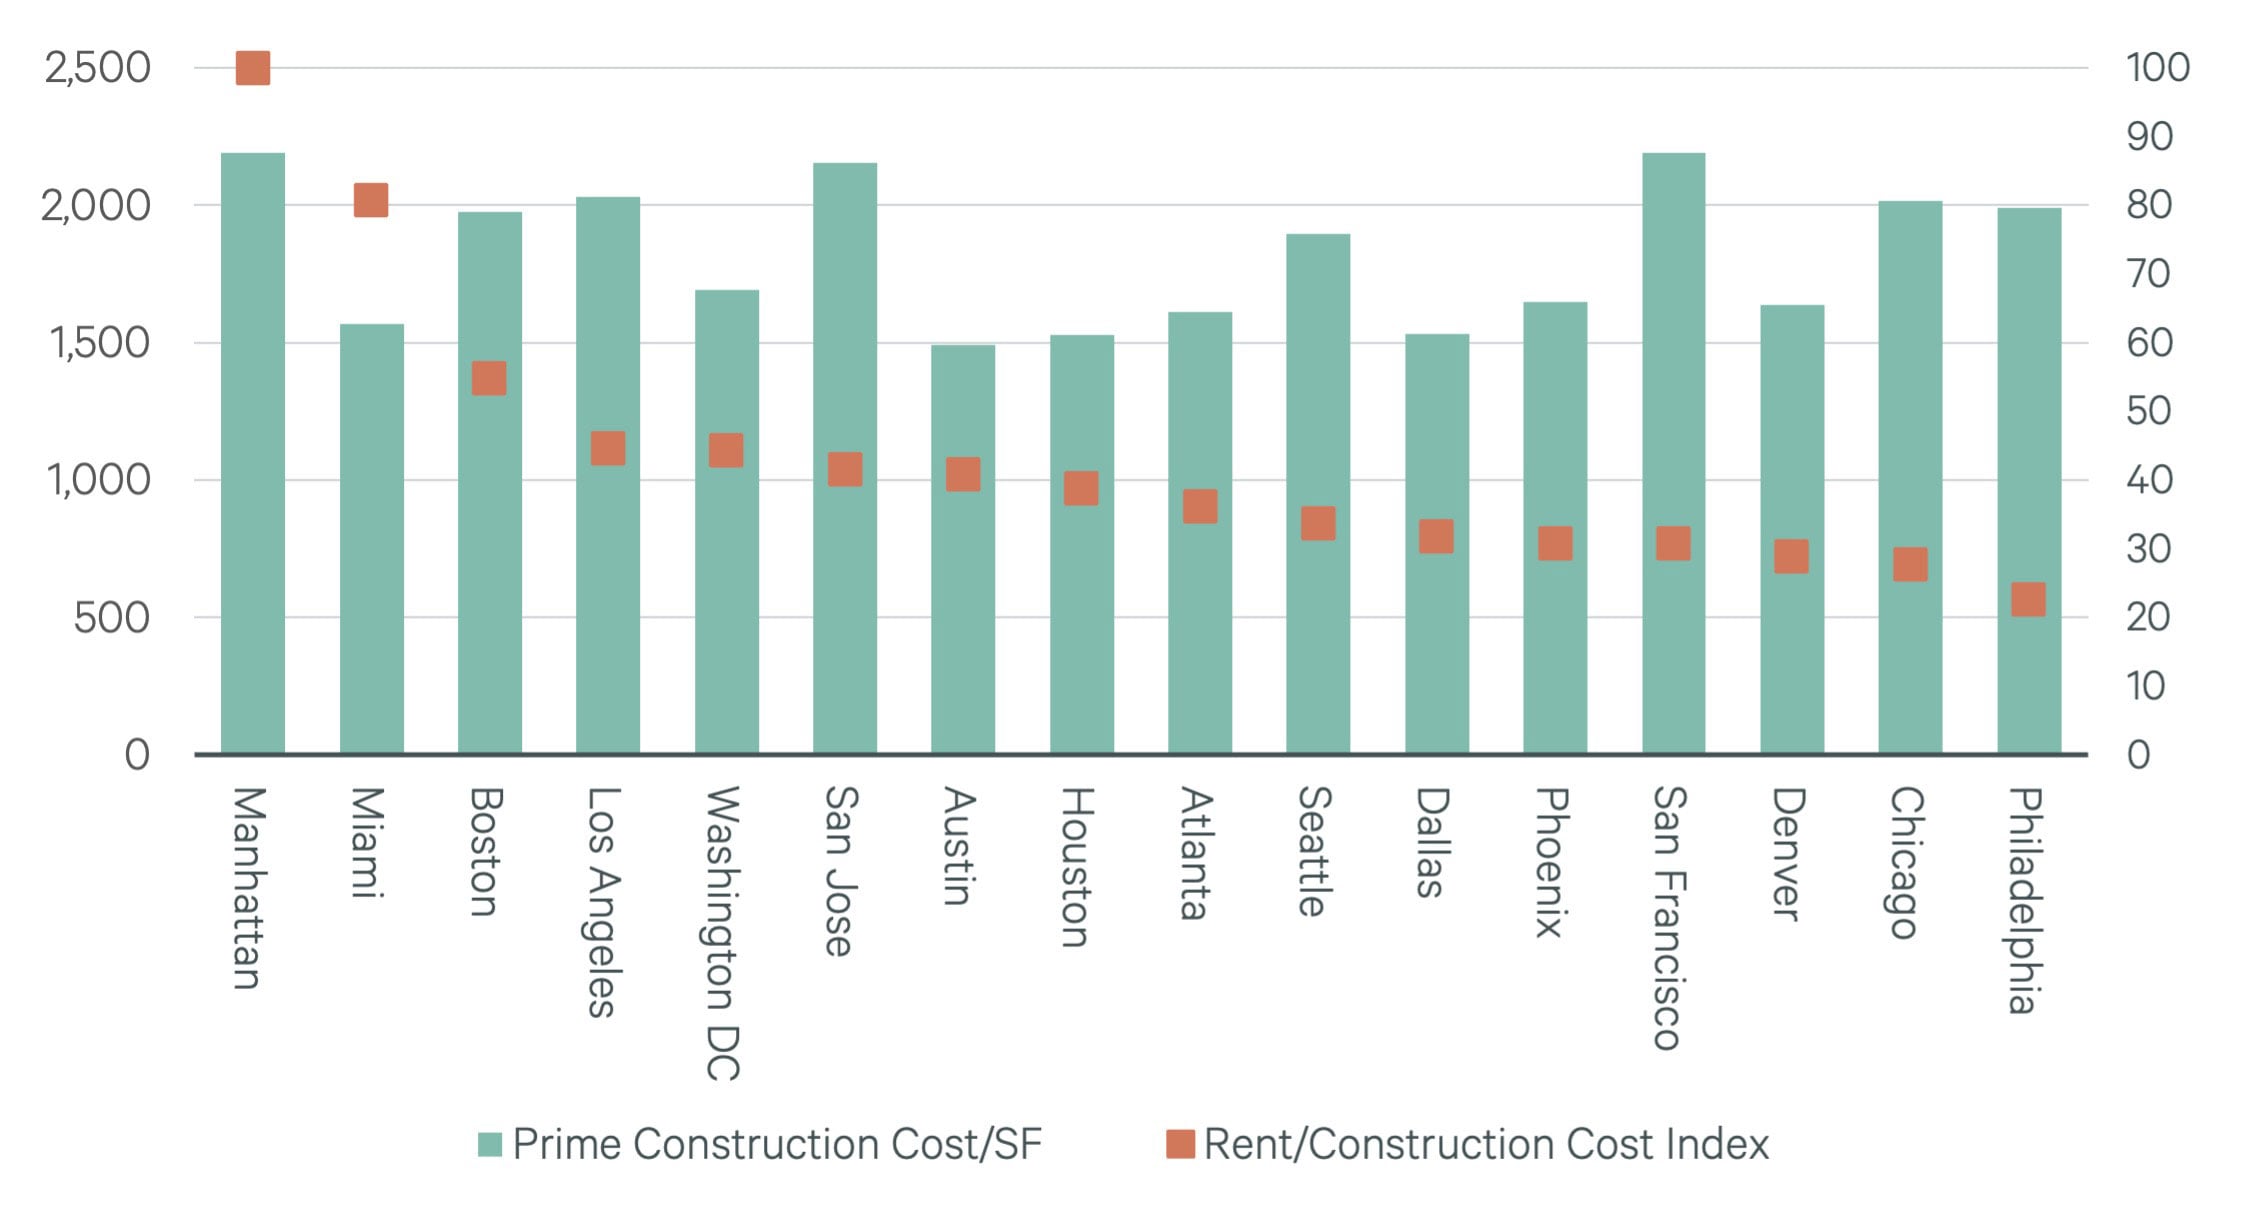
Figure 7: Current Construction by Market
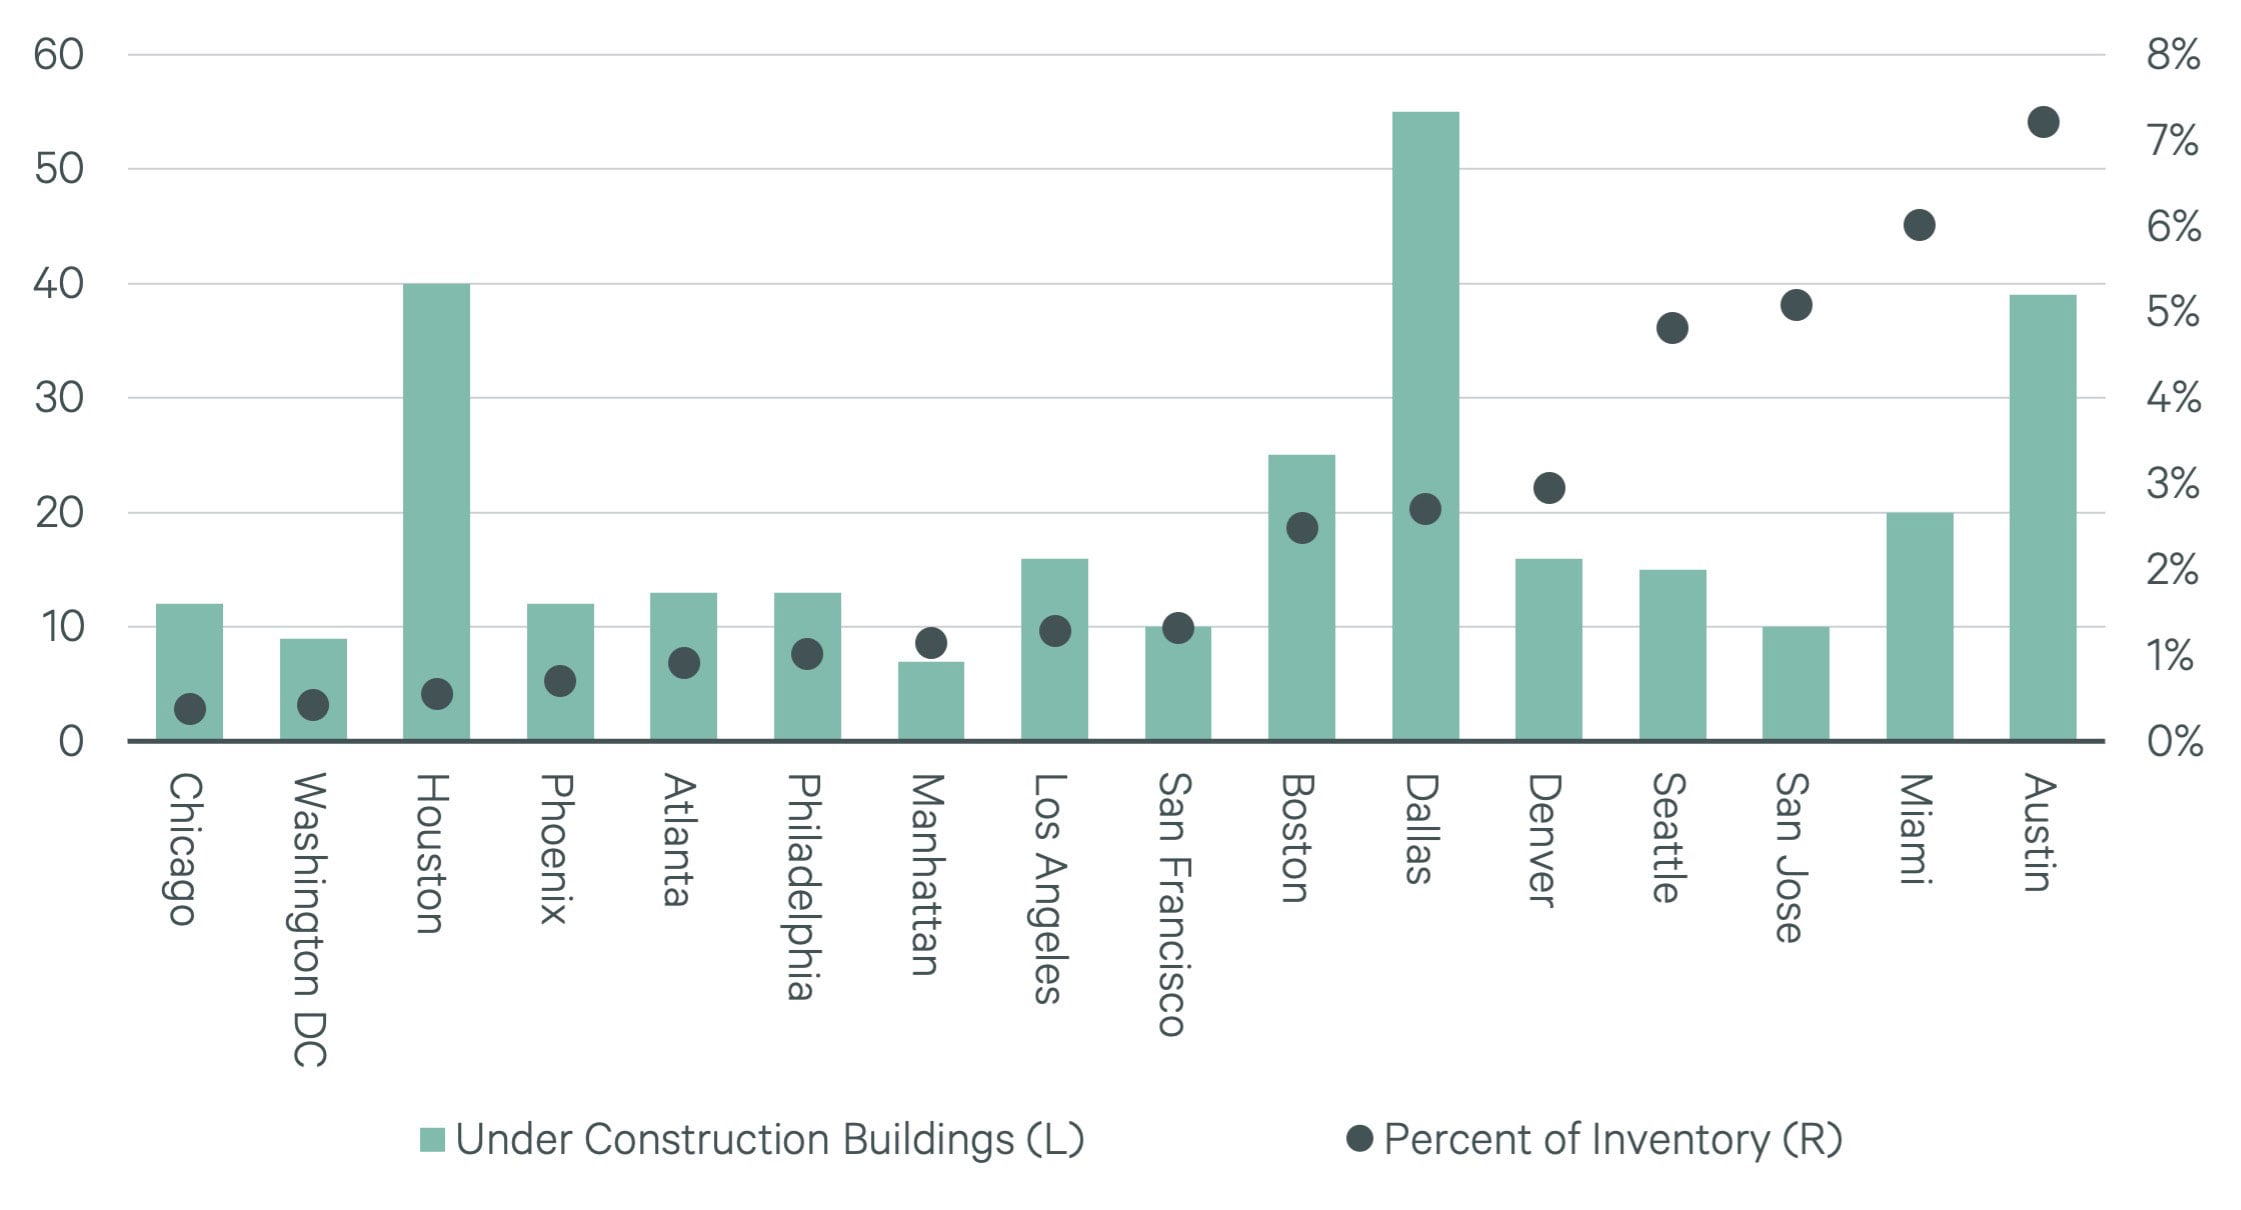
Figure 7 presents the last metric we examine for our markets, the current under construction pipeline. All else equal, a smaller development pipeline is preferable due to less future competition for tenants. While it would be more useful to examine the prime pipeline only, we do not have construction projects designated as prime or not. We tracked both the number of office buildings under construction as well as the total square feet under construction as a percentage of total inventory. Chicago has the smallest pipeline with only 0.4% of inventory and 12 buildings. Dallas has 55 buildings in development, but at 2.7% of inventory is only slightly above average. Austin has the largest overall office pipeline as of Q4 2023 with more than 7% of inventory under construction. It is followed by Miami, San Jose and Seattle, which are all above 4% of inventory.
Table 1: Prime Development Attractiveness by Market

In table 1, we rank each market from most to least attractive across our three primary metrics. Using the simple average of each rank, we sort markets from the best to worst prime development opportunity, relative to one another. Miami stands out as the most attractive market for developing prime office properties. Seattle is our least attractive market for prime development.
Conclusion
Prime properties command higher rents with higher occupancy due to their younger ages and higher quality. However, to build out a best-in-class office space, developers will have to pay a significant construction premium. While development site selection is an extremely complex process that requires far more information than this report provides, we believe it provides a starting point for identifying some markets with attractive and unattractive characteristics for development.
When examining different attributes, different markets look most attractive. However, taken as a whole, several markets appear to be attractive across every metric. Miami stands out due to its large prime rent premium, low prime vacancy, and low fraction of prime space. While the pipeline is not negligible at 6.4 percent of inventory, one of the reasons it’s not even higher is the exorbitant price of land, where developable areas can attract offers for more than $77 million per acre. On the one hand, this caps competition. On the other, it makes these projects hard to pencil out. This serves as a reminder that commercial real estate is a hyper local industry, and every deal is unique. With that said, the data points to opportunity for prime development to outperform in certain markets (Miami, Boston, D.C.) more so than others.
Related Service
CBRE’s trusted specialists in economics, data science, and forecasting at Econometric Advisors deliver the most sought-after analytical real estate re...
Contacts
Dennis Schoenmaker, Ph.D.
Global Head of Forecasting and Strategic Insight, Head of Data Centre of Excellence


