Adaptive Spaces
2026 Global Workplace & Occupancy Insights
This four-part series offers timely guidance for organizations seeking to align their workplace with business goals and corporate culture.
January 20, 2026 5 Minute Read

Explore More Benchmarking Data
Leverage our office occupancy benchmarking dashboard to enhance decision-making. Customize filters by sector and region.
About the Series
CBRE’s 2026 Global Workplace & Occupancy Insights is a four-part series that explores the hybrid workplace, offering a data-driven roadmap for organizations adapting their real estate, operations and culture.
The series covers hybrid's evolution: designing a connected employee experience, aligning leadership and employee expectations, leveraging AI and technology for space optimization and preparing CRE professionals for the future of work. The goal: building a thriving hybrid workplace.
The 2026 Global Workplace & Occupancy Insights summarize five years of office benchmarking and sentiment surveys on how CBRE clients have adapted their office environments since 2021. The study examines global data from CBRE clients representing 303 million sq. ft./28 million sq. m., with an average office portfolio size of 5 million sq. ft., and delivers insights by portfolio size, industry/sector and region/geography.

The Hybrid Reality: Why the Office Is More Important Than Ever
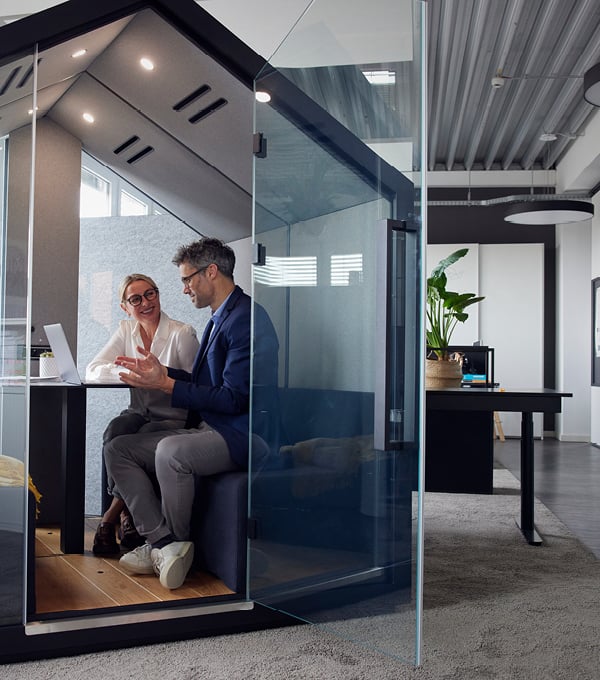
Beyond the Desk: How to Design Offices That Draw Employees In
We delve into the art of designing offices that truly attract. The aim is to create destinations, not just workstations, by prioritizing experiences that foster collaboration and community. The data is clear: The most important reason employees come into the office is to collaborate with colleagues, cited by 68% of respondents. This underscores the critical role of thoughtful planning in shaping the future of work.

Data at the Heart of Hybrid: Leveraging AI & Tech to Optimize the Workplace