Broader Availability of Real Estate Financing
Volatility in the 5‑Year IRS swap rate has declined significantly
In line with the earlier‑described movements in inflation and government bond yields, the real estate financing market has entered calmer waters after several turbulent years. Despite a few increases throughout the year, the 5‑year IRS swap rate has remained within a narrow 35‑basis‑point range over the past six months, fluctuating between 2.25% and 2.60%. Over the next twelve months, interest rates are expected to remain broadly stable, with at most a slight upward movement. As a result, financing certainty is improving, and building a solid business case has become more predictable.
Cautious leverage decisions by investors
Notably, many investors are opting for lower loan‑to‑value (LTV) ratios below 60%, despite the wide availability of competitively priced financing options with higher leverage. In doing so, investors are explicitly prioritizing balance‑sheet protection and flexibility. An exception can be found in sell‑off (“uitpond”) portfolios, which are typically financed by major banks and tend to involve higher initial leverage. As individual residential units are sold during the holding period, repayments accelerate, causing the LTV to decline rapidly and improving the overall risk profile.
More financing providers for retail and office assets
Where residential and logistics real estate have long been well financeable, the number of lenders active in the retail and office segments is now also increasing. Stable vacancy rates and consistent rental expectations are strengthening the risk profile of retail properties. In the office market, capital is primarily directed toward higher‑quality office products. Offices in secondary cities, however, continue to face greater challenges in securing competitively priced financing, despite generally low vacancy levels in these peripheral locations.
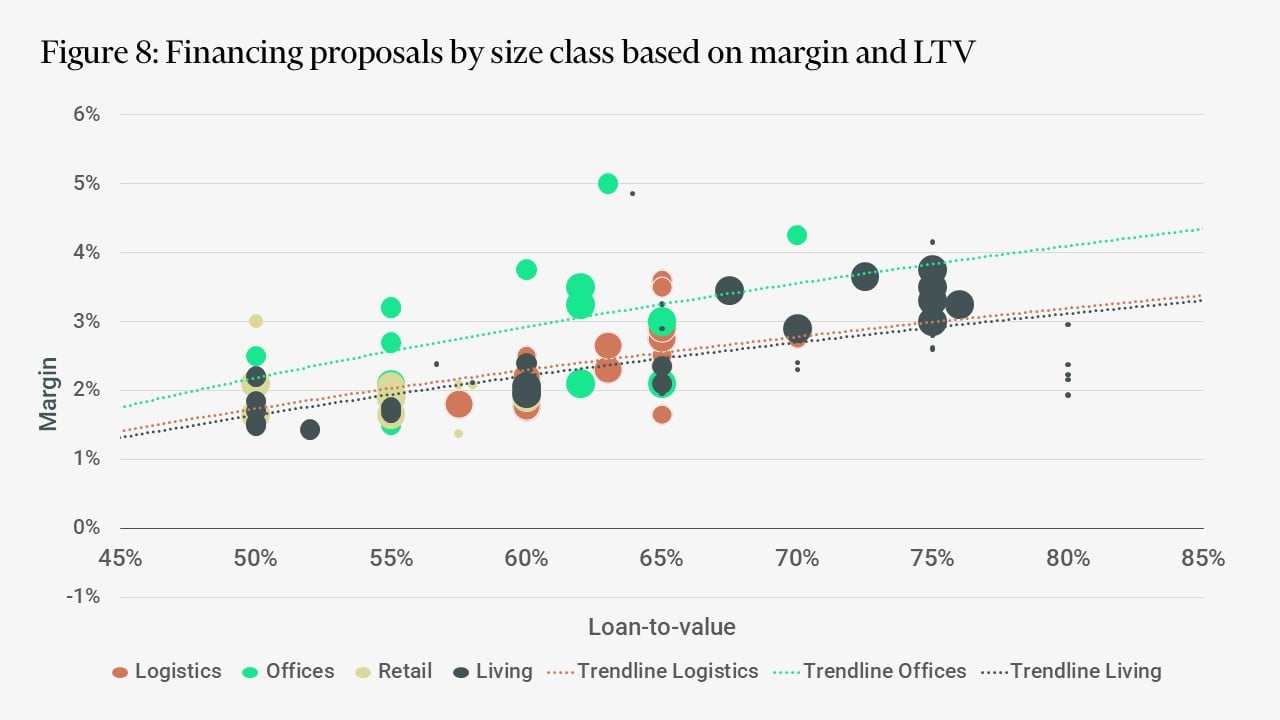
Significantly Higher Margins for Loan‑to‑Value Ratios Above 60%
LTV as the Key Driver of Real Estate Financing Margins
Looking at the range of financing offers CBRE receives from various lenders, most margins fall between 140 and 300 basis points. The exact margin depends on factors such as asset quality, location, building condition, and the specific investment proposition. However, the most decisive factor is the level of leverage. As the loan‑to‑value (LTV) ratio increases, margins rise sharply. This is largely explained by the higher risk taken on by lenders at higher leverage levels. In addition, the number of debt funds operating in this part of the market is growing, which further contributes to the elevated margins.
Nevertheless, CBRE observes internationally that financing margins for larger transactions are declining. Over the past year, margins for these types of loans have decreased by roughly 75 basis points compared with the end of 2024. The main reason for this reduction is the improved and more cost‑effective availability of back leverage in the market, as well as increasing activity in the commercial mortgage‑backed securities (CMBS) market.
Construction financing remains scarce
Construction financing continues to be one of the market segments with the lowest availability of capital, similar to previous years. A few major Dutch banks dominate this space, while foreign lenders generally focus on their domestic markets and show limited interest beyond them. The main exception is large-scale renovation or redevelopment projects: because these involve financing an existing asset, international lenders tend to be more open to providing capital for such schemes.
The limited number of active players is largely driven by the allocation structure of construction loans. Lenders deploy capital in phases rather than in a single upfront commitment. In addition, construction loans typically come with short maturities, making them less attractive for institutions such as insurance companies that prefer simplicity and longer-term placements. Larger debt funds do explore this market when they have sufficient liquidity that cannot be deployed elsewhere at short notice. In thoseinstances, theyshow greaterwillingnesstoprovideconstructionfinancing