Intelligent Investment
Office Leasing Activity Edges Up in April
CBRE Pulse of U.S. Office Demand
May 20, 2022 5 Minute Read
Read the full report and data for all 12 markets
U.S. office leasing activity edged slightly higher in April, while tenant requirements ticked down and sublease availabilities were unchanged. Office leasing activity is expected to improve as return to office plans gain momentum, but economic and geopolitical headwinds may slow the pace of recovery.
What is the CBRE Pulse Report?
To gauge the pace of recovery, CBRE has created three indices for the 12 largest U.S. office markets—Atlanta, Boston, Chicago, Dallas/Fort Worth, Denver, Houston, Los Angeles, Manhattan, Philadelphia, San Francisco, Seattle and Washington, D.C.
Using CBRE data, these indices measure office market activity each month and provide early indications of when and where momentum in office demand may be shifting.
These metrics—space requirements of active tenants in the market (TIM), leasing activity and sublease availability—provide a clear picture of office demand amid the COVID-19 pandemic.
April Findings
The U.S. Leasing Index increased by 1 point to 79 in April, ending five months of decline. While its trajectory has been volatile month to month, the index is up 16 points from a year ago. Four of the 12 markets tracked by CBRE had increases in leasing activity in April. The largest improvements occurred in Boston (+45 points) and Houston (+31 points), where leasing index levels are now at or above their pre-pandemic baseline. Manhattan posted the largest increase in its leasing index in six months (+12 points).
The U.S. Tenants in the Market (TIM) Index fell by 2 points in April to 89. Eight markets had TIM levels that increased or remained stable. Three had levels above their pre-pandemic average: Houston (121), Manhattan (107) and Boston (104). A sizeable drop in Dallas/Fort Worth’s index level was driven by a few large tenant requirements that resulted in signed leases. Tenant requirements in Washington D.C., San Francisco and Los Angeles remained more than 25 points below their pre-pandemic level.
The U.S. Sublease Availability Index was unchanged at 199 in April. The index has hovered within a 10-point range since August 2021. Seven of the 12 markets recorded an increase in their sublease inventory in April, while five had declines. Sublease index levels remain stubbornly high in San Francisco, Philadelphia, Seattle, Atlanta and Manhattan.
Outlook
The office recovery remains sluggish. Tenant requirements are near pre-pandemic levels, but occupiers are carefully weighing the implications of hybrid work arrangements before making long-term leasing decisions. While the waning of COVID restrictions has supported the return to the office, headwinds such as geopolitical uncertainty, persistent inflation and potentially weaker job growth may continue to slow the office market recovery in coming months.
Notes: All market data is for the metropolitan area except for San Francisco, which only includes the downtown market, and for Manhattan. Prior months data has been revised from previous reports to reflect new information. Data presented in this report supersedes that of previous editions of the Pulse of U.S. Office Demand.
U.S. Average Performance Index
Figure 1: Indexed Average Performance of Sublease Availability, TIM and Leasing Activity for the Top 12 U.S. Markets
Source: CBRE Research, April 2022.
April Demand Recovery by Market
Boston and Dallas/Fort Worth continued to set the pace for office demand recovery in April. Manhattan and Houston also saw notable increases in leasing activity. Occupiers remained cautious in Atlanta, Seattle, Washington, D.C. and Chicago, while Philadelphia saw a rise in sublease availabilities and a slowdown in leasing. However, more tenant requirements in the market may augur improved activity later this year.
Figure 2: April Office Market Recovery Scale, Top U.S. Markets

Source: CBRE Research, April 2022.
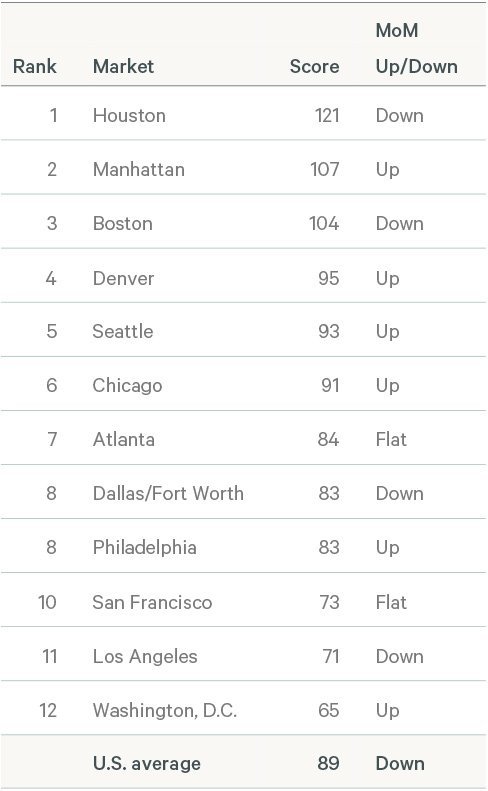
Tenants in the Market Index
Figure 3: Indexed Square Footage of Tenant Requirements Compared with 2018/2019 Average
Source: CBRE Research, April 2022.
The U.S. Tenants in the Market (TIM) Index fell 2 points to 89 in April, matching its level in January and February. The decrease comes off the pandemic-era high that was reached in March, as some tenant requirements resulted in signed leases. However, the index is up 7 points from one year ago.
Three markets—Houston (121), Manhattan (107) and Boston (104)—had TIM Index levels above their pre-pandemic levels, while three others—Denver (95), Seattle (93) and Chicago (91)—were near their pre-pandemic levels.
Figure 4: April 2022 TIM Index–Top 12 U.S. Markets
Source: CBRE Research, April 2022.
TIM Index methodology note: CBRE tracks the total square footage of requirements from active tenants in the market, with minimum requirements of 10,000 sq. ft. The TIM Index compares the total monthly TIM requirements to a pre-pandemic baseline, which is the average of TIM requirements recorded by CBRE in 2018 and 2019. The index level for the baseline is 100. In most cases, when tenant requirements are given as a range, the index uses the minimum square footage., However, Seattle records TIM using the average requirement within the tenants' size range, while Philadelphia uses the maximum square footage.
Leasing Activity Index
Figure 5: Indexed Monthly Leasing by Market Compared with 2018/2019 Average
Source: CBRE Research, April 2022.
The U.S. Leasing Activity Index inched up by 1 point to a level of 79 in April, following five months of decline. The biggest increases were in Boston (+45 points) and Houston (+31 points). A few sizable leases were signed in new construction in Boston, raising the market’s Leasing Activity Index level to 198—the highest of all Pulse markets. In Houston, the leasing of a sizeable sublease availability and a large renewal boosted its index level.
Leasing levels were near or above pre-pandemic levels in four markets: Boston (198), Los Angeles (116), Houston (100) and Dallas/Fort Worth (97). Manhattan (81) saw its second month of improvement, as its index level has improved by more than 20 points since February.
Figure 6: April 2022 Leasing Activity Index –Top 12 U.S. Markets

Source: CBRE Research, April 2022.
Leasing Index methodology note: Leasing activity includes all new leases, expansions and renewals of 10,000 sq. ft. or more that close each month. The Leasing Activity Index uses a rolling three-month average of leasing activity. Most markets the weighted 20% for the current month, 50% for the previous month and 30% for two months prior. For New York and Boston, where more accurate leasing data is available by the end of each month, the weights are 50% for the current month, 30% for the previous month and 20% for two months prior. The monthly rolling average is compared with a pre-pandemic baseline, which is the average monthly leasing activity between 2018 and 2019. The index level for the baseline is 100.
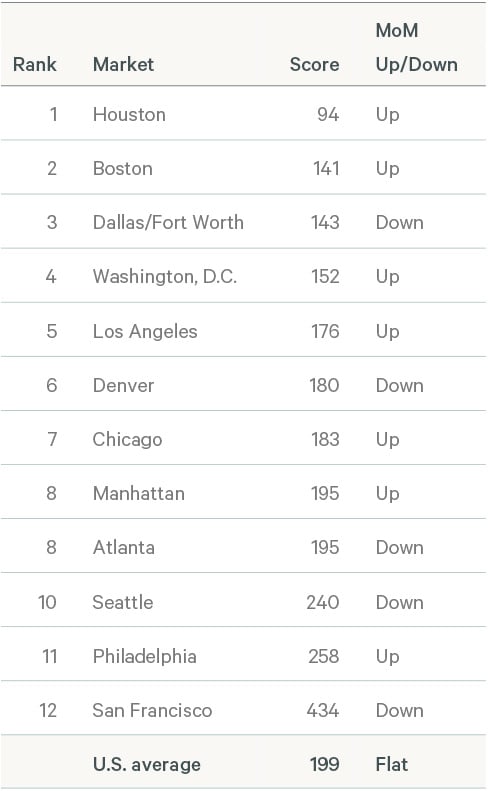
Sublease Availability Index
Figure 7: Indexed Sublease Availability by Market Compared with 2018/2019 Average
Source: CBRE Research, April 2022.
The U.S. Sublease Availability Index was unchanged in April at 199. While stubbornly high, the index is below its pandemic-era peak of 206 in June 2021.
Seven of the 12 Pulse markets recorded increases in their Sublease Availability Index in April, though most changed by 5 points or less. Philadelphia had the biggest increase (+18 points), while San Francisco had the biggest decrease (-17 points). Nevertheless, San Francisco had the highest index level at 434.
Houston (94) remained the only market with an index level below its pre-pandemic baseline. The second and third-ranking markets—Boston (141) and Dallas/Fort Worth (143)—are still behind by a wide margin.
Sublease Index methodology note: Sublease availability measures the total square footage of sublease space available for occupancy. The Sublease Availability Index compares monthly sublease availability totals with a pre-pandemic baseline, which is the average amount of sublease space available in 2018 and 2019. The index level for the baseline is 100.
Note: In contrast to the Leasing and TIM Indices, a higher score on the Sublease Index is considered undesirable as it reflects an increase in available sublease space.
Figure 8: April 2022 Sublease Availability Index –Top 12 U.S. Markets
Source: CBRE Research, April 2022.
Related Insights
- Brief | Intelligent Investment
U.S. Office Leasing Activity Slows in March but Tenant Interest Grows
April 20, 2022 5 Minute Read
Tenant requirements climbed to a pandemic-era high in March, but the rise in search activity wasn't enough to improve CBRE's Pulse of U.S. Office Demand tracker.
The CBRE Pulse of U.S. Office Demand slowed for a second consecutive month in February.
- Brief | Intelligent Investment
Omicron Impact on U.S. Office Demand Persists in January
February 17, 2022 5 Minute Read
The CBRE Pulse of U.S. Office Demand slowed in January, as occupiers paused on leasing activity in the face of the omicron surge.
- Brief | Intelligent Investment
Omicron Surge Slows U.S. Office Demand in December
January 26, 2022 5 Minute Read
The CBRE Pulse of U.S. Office Demand slowed moderately in December, likely reflecting renewed occupier caution over the COVID-19 omicron surge.
