Future Cities
Dallas-Ft. Worth
2024 North America Industrial Big-Box Review & Outlook
April 29, 2024 5 Minute Read

Demographics
Nearly 8 million people live within 50 miles of the market’s core—nearly a quarter aged 18-34—with 6.9% projected growth over the next five years. This is the highest growth rate of any U.S. market in this report. Over 28 million people live within 250 miles, with 4.9% projected growth over the next five years.
Figure 1: Dallas-Fort Worth Population Analysis

The local warehouse labor force of 157,283 is expected to grow by 14.6% by 2034, according to CBRE Labor Analytics. The average salary of a non-supervisory warehouse worker is $18.22 per hour, 2.6% above the U.S. average.
Figure 2: Dallas-Fort Worth Warehouse & Storage Labor Fundamentals
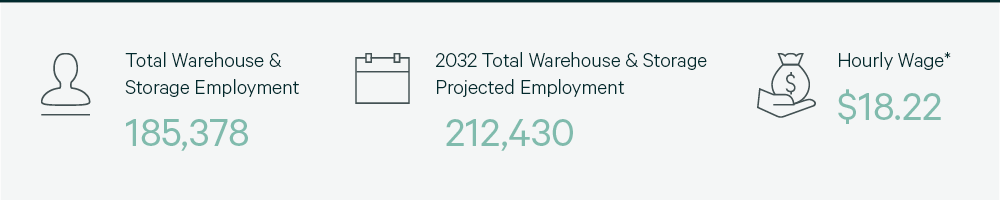
*Median wage (1 year experience); non-supervisory warehouse material handlers.
Location Incentives
Over the past five years, there have been over 210 publicly-known economic incentives deals totaling more than $870 million at an average of $15,600 per new job in metro Dallas-Ft. Worth, according to fDi Intelligence.
CBRE’s Location Incentives Group reports that top incentive programs offered in Dallas Ft. Worth include the Texas Enterprise Fund (TEF). TEF is considered a “deal-closing” grant because it incentivizes construction in Texas. Awards are based on an analytical model that factors in the average new employee wage, hiring timeline and a company’s total capital investment.
Another program is the Skills Development Fund, offering job training grants to community and technical colleges for customized training programs that support Texas businesses. This job training program is designed to upskill new or existing employees, as well as increase wages.
Figure 3: Dallas-Fort Worth Top Incentive Programs
Note: The extent, if any, of state and local incentive offerings depends on location and scope of the operation.
Logistics Driver
Dallas-Ft. Worth’s central location is a significant advantage in reaching a large consumer base. The region is home to two major inland ports: Alliance Global Logistics Hub and the International Inland Port of Dallas.
The confluence of three major railroad networks (Union Pacific, Burlington Northern-Santa Fe and Kansas City Southern) puts 98% of the U.S. market within 48 hours by train. DFW International Airport is the nation's ninth-largest cargo airport and the only one with capacity to double operations in its existing footprint. All major U.S. markets can be reached by air in less than four hours.

The confluence of three major railroad networks (Union Pacific, Burlington Northern-Santa Fe and Kansas City Southern) puts 98% of the U.S. market within 48 hours by train.
Supply & Demand
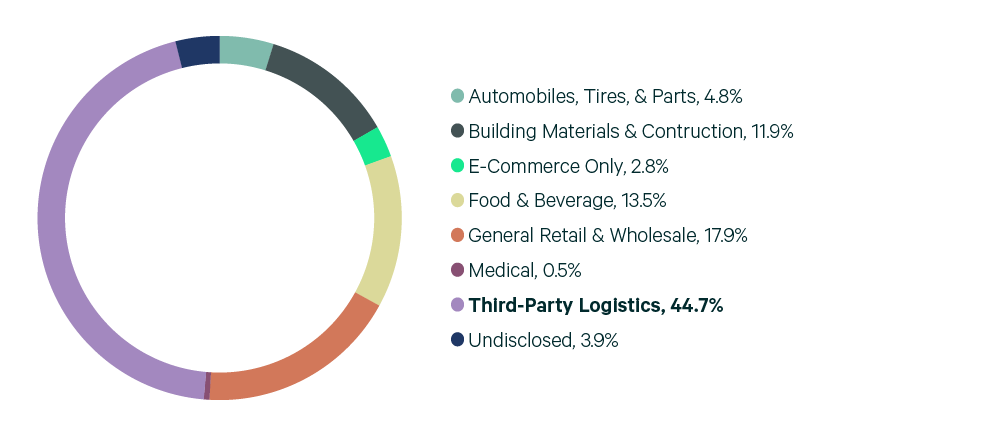
With 516.2 million sq. ft. of total inventory, Dallas-Ft. Worth is the third-largest big-box market in North America. Occupiers continue to move in and expand: a total of 32.4 million sq. ft. was leased, only slightly less than 2022’s 34.5 million sq. ft. This was the second most big-box leasing in North America. 3PLs accounted for 44.7% of lease transactions, by far the most of any occupier type. Despite robust leasing and nearly 30 million sq. ft. of positive net absorption, vacancy rates nearly doubled to 9.5% due to a record 53.1 million sq. ft. of completed construction, the most in North America.
Only 25.6 million sq. ft. was under construction at year-end with 22% preleased. This reduced development should help stabilize vacancy rates, but a significant vacancy reduction will require an increase in new leasing. The current stability in vacancies is expected to help maintain market rents at current record highs for the foreseeable future.
Figure 4: Share of 2023 Leasing by Occupier Type
Source: CBRE Research.
Figure 5: Lease Transaction Volume by Size Range
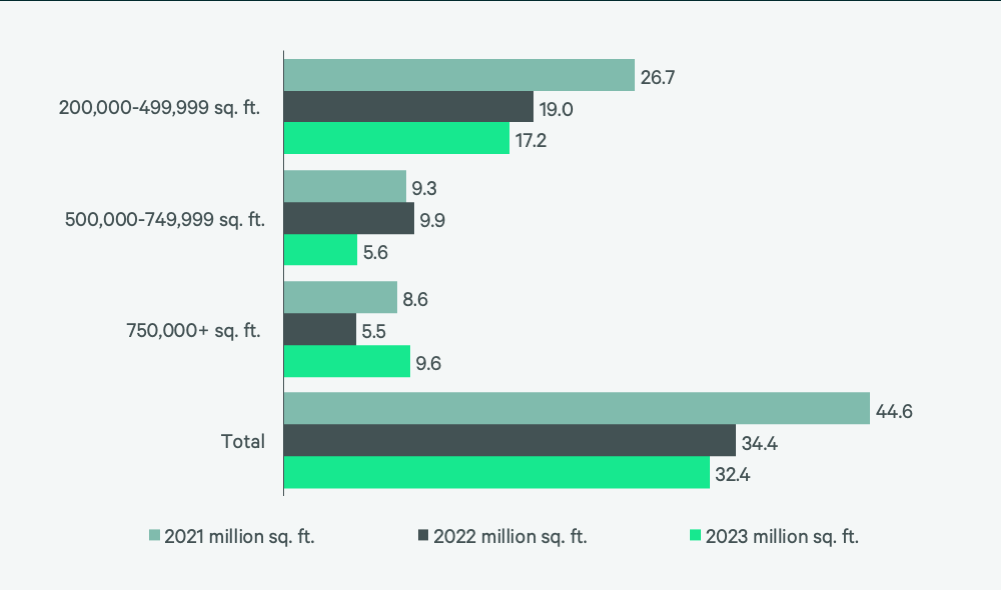
Source: CBRE Research.
Figure 6: 2023 Construction Completions vs. Overall Net Absorption by Size Range
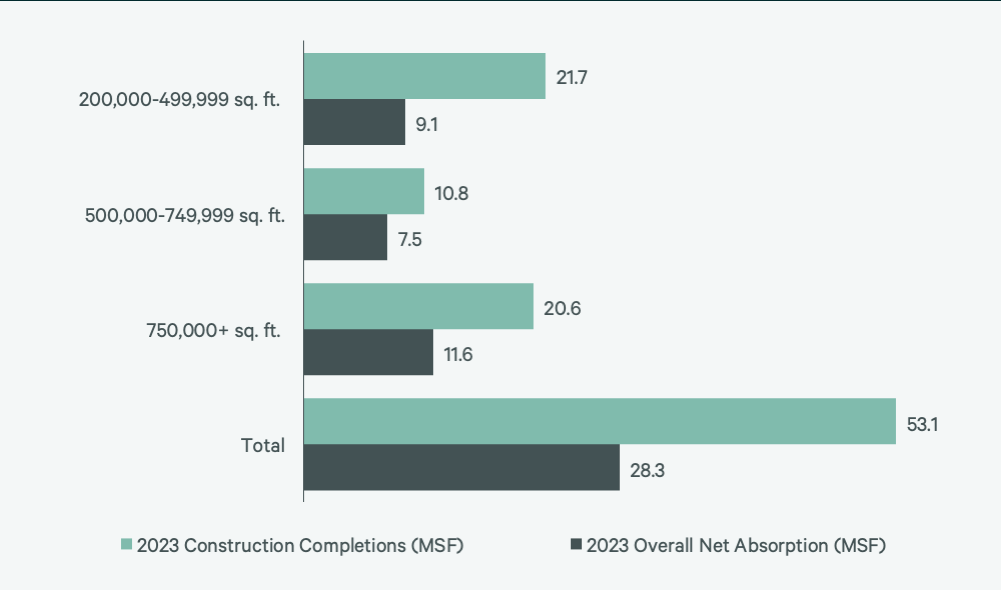
Figure 7: Direct Vacancy Rate by Size Range
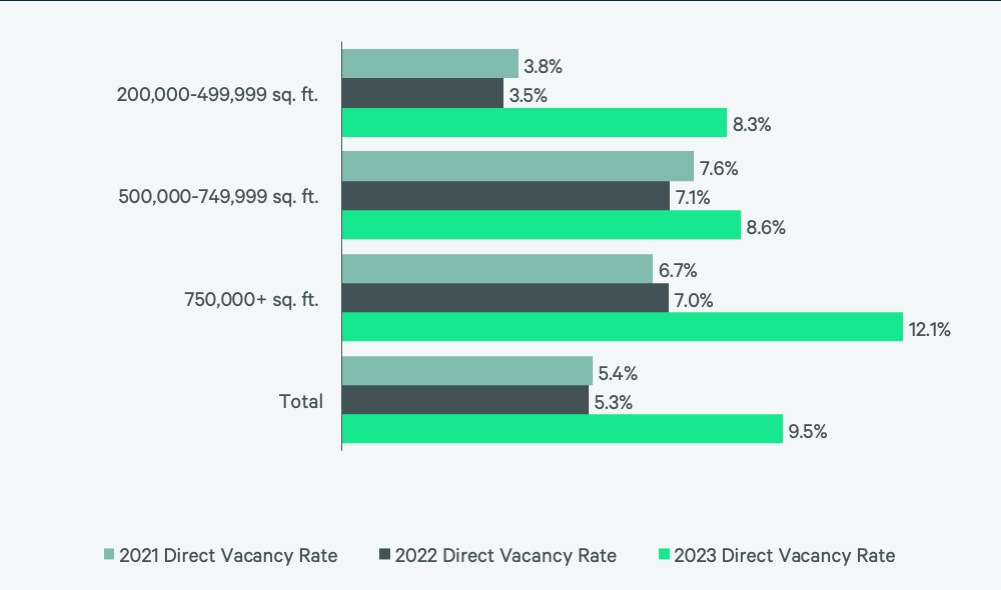
Figure 8: Under Construction & Percentage Preleased

Figure 9: First Year Taking Rents (psf/yr)
Source: CBRE Research.
Explore Big-Box Insights by Market
-

More than 7 million people live within 50 miles of the market’s core–a quarter aged 18-34–with five-year growth of 5.3% expected, third to only Dallas-Ft. Worth and Nashville.
-

Kansas City’s biggest draw is its easy reach to a large portion of the country.
-

Over 1.4 million people–23% aged 18-34–live within 50 miles of downtown Memphis.


