Future Cities
Houston
2024 North America Industrial Big-Box Review & Outlook
April 29, 2024 5 Minute Read

Demographics
More than 7 million people live within 50 miles of the market’s core–a quarter aged 18-34–with five-year growth of 5.3% expected, third to only Dallas-Ft. Worth and Nashville. Over 26 million people live within 250 miles, with expected growth of 4.7%.
Figure 1: Houston Worth Population Analysis

The local warehouse labor force of 124,110 is expected to grow 11.6% by 2034, according to CBRE Labor Analytics. The average wage for a non-supervisory warehouse worker is $18.24 per hour, 2.8% above the national average.
Figure 2: Houston Warehouse & Storage Labor Fundamentals

*Median wage (1 year experience); non-supervisory warehouse material handlers.
Location Incentives
Over the past five years, there have been over 100 economic incentives deals totaling more than $380 million for an average of $48,900 per new job in metro Houston, according to fDi Intelligence.
CBRE’s Location Incentives Group reports that top incentive programs offered in Houston include the Texas Enterprise Fund (TEF). TEF is considered a “deal-closing” grant because it incentivizes construction in Texas. Awards are based on an analytical model that factors in the average new employee wage, hiring timeline and a company’s total capital investment.
Another program is the Skills Development Fund, offering job training grants to community and technical colleges for customized training programs supporting Texas businesses. This program is designed to upskill new or existing employees and increase wages.
Figure 3: Houston Top Incentive Programs
Note: The extent, if any, of state and local incentive offerings depends on location and scope of the operation.
Logistics Driver
Houston offers an impressive array of distribution channels. Its central location makes it easy to reach both coasts within hours. The Port of Houston is the Gulf Coast’s largest container port and is instrumental in the city’s development of international trade. This market is home to the nation’s largest and world’s second-largest petrochemical complex. Carrier services on all major trade lanes link Houston to all international markets. The shipping channel also intersects a very busy barge traffic lane, the Gulf Intracoastal Waterway.

This market is home to the nation’s largest and world’s second-largest petrochemical complex.
Supply & Demand
Houston remains one of North America’s top growth markets despite a decline in leasing . Lease transaction volume decreased by 46% from 2022’s record pace to 10.4 million sq. ft. Despite this decrease, Houston was North America’s third growth market (net absorption/existing inventory) with 13.6 million sq. ft. absorbed. However, new supply outpaced demand as a record 32.7 million sq. ft. of construction was completed, raising the vacancy rate to 7.8%. A diverse set of occupiers leased space in 2023, led by 3PLs at 33.2% of total volume, followed by general retail & wholesale at 28.5%, and building materials & construction at 20.7%.
By the end of 2023, only 10.4 million sq. ft. of space was under construction, a 63% year-over-year decline, with nearly half preleased. Transaction volume should increase this year as improved economic clarity attracts more tenants into Houston that want to leverage its growing population and numerous logistics drivers. The combination of increased demand and significantly decreased supply is expected to lower vacancy rates by the end of this year.
Figure 4: Share of 2023 Leasing by Occupier Type
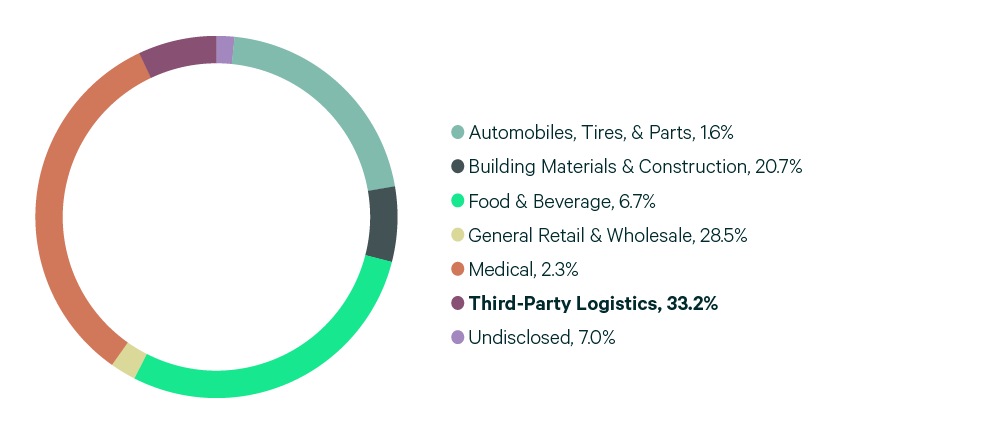
Source: CBRE Research.
Figure 5: Lease Transaction Volume by Size Range

Source: CBRE Research.
Figure 6: 2023 Construction Completions vs. Overall Net Absorption by Size Range

Figure 7: Direct Vacancy Rate by Size Range

Figure 8: Under Construction & Percentage Preleased
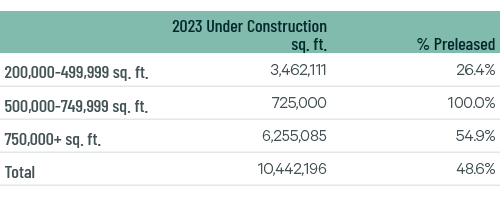
Figure 9: First Year Taking Rents (psf/yr)
Source: CBRE Research.
Explore Big-Box Insights by Market
-

Nearly 8 million people live within 50 miles of the market’s core—nearly a quarter aged 18-34—with 6.9% projected growth over the next five years.
-

Kansas City’s biggest draw is its easy reach to a large portion of the country.
-

Over 1.4 million people–23% aged 18-34–live within 50 miles of downtown Memphis.


