Future Cities
2023 North America Industrial Big Box Review & Outlook: Los Angeles County
April 4, 2023 5 Minute Read

Los Angeles County contains North America’s two largest ports and one of the largest population concentrations. Demand for big-box product is robust but a vacancy rate under 1% has subdued leasing activity. This trend will continue since there is little land to development. Rental rates will continue rising due to constrained supply, despite a softening economy.
Demographics
Over 15 million people live within 50 miles of the market core—the third most in the U.S. Nearly 26% of this population are aged 18-34. This total is expected to decline by 1.2% over the next five year. Nearly 29 million people live within a 250-mile radius, with no five-year change expected.
Figure 1: Los Angeles County Population Analysis
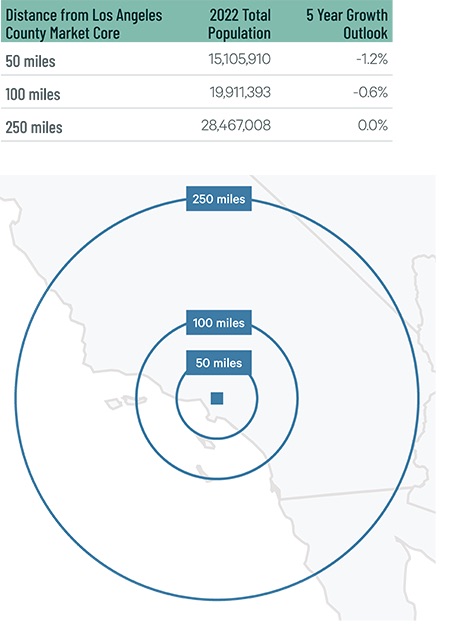
Source: CBRE Location Intelligence, Q4 2022.
Los Angeles County’s warehouse labor force of 218,854 is the U.S.’s third-largest and expected to grow by 4.1% by 2032, according to CBRE Labor Analytics. The region has a high cost of living and its average hourly wage is also one of the country’s highest at $20.16—20% above the national average.
Figure 2: Los Angeles County Warehouse & Storage Labor Fundamentals

Source: CBRE Labor Analytics, Q4 2022.
*Median wage (1 year experience); non-supervisory warehouse material handlers.
Location Incentives
Over the past five years, there have been 157 publicly known economic incentives deals totaling over $300 million for an average of $17,205 per new job in metro Los Angeles, according to Wavteq.
CBRE’s Location Incentives Group reports that top incentive programs offered in Los Angeles County include the California Competes Tax Credit, a discretionary income tax credit for businesses that locate to or expand in California. This program was extended through 2023 with $180 million in credits for businesses that make capital investments, create new jobs and offer strategic importance to the state. The credits are non-refundable, and applications are only open three times per year.
Figure 3: Los Angeles County Top Incentive Programs
Source: CBRE Location Incentives Group, Q4 2022.
Note: The extent, if any, of state and local incentive offerings depends on location and scope of the operation.
Logistics Driver
Los Angeles County contains North America‘s two largest seaports and one of the country’s top five air cargo hubs. Imports and exports flowing through the ports of Los Angeles and Long Beach directly feed the region’s big-box distribution centers. Imports significantly declined year-over-year in 2022 due to less demand for new inventory, continued labor issues, and companies diversifying their import strategy to the east coast. These ports will remain the country’s most active for years to come.
Los Angeles International (LAX) is the U.S.’s fifth-busiest air cargo airport. LAX is a convenient and efficient major air cargo distribution center because of the available vital allied services, especially for Pacific Rim traders. The LA-area cargo trade also engages more than 800 freight forwarders and 360 customs house brokers, who expedite the region’s air cargo delivery. U.S. banks with international operations have offices in LA, as do foreign banking institutions.

LAX is a convenient and efficient major air cargo distribution center because of the available vital allied services, especially for Pacific Rim traders.
Capital Markets
2022 saw increases in cap rates. On average, cap rates increased 1% but vary greatly depending on lease term and percentage below market. Volumes decreased because, often, buyers and sellers had different valuation perspectives. However, improved activity at the end of 2022 could bode well for stronger volumes in 2023.
Supply & Demand
Los Angeles County is one of North America’s most mature big-box markets. It is dominated by buildings built before 2000, with 85% under 500,000 sq. ft. The region has North America’s second-lowest direct vacancy rate at 0.6%. The low vacancy rate directly affected transaction volume, which was half of 2021’s total at 6.4 million sq. ft. 3PLs dominated transaction volume, with a market share of 53%. Occupiers outsourced to 3PLs in the region at a high rate because of difficulties finding available space and increases in facility costs.
Taking rents are part of those costs, which finished first in the nation at $16.22 per sq. ft., 29% higher year-over-year. Just 1.2 million sq. ft. of new construction was completed last year. But 4.4 million sq. ft. is under construction, with 11% pre-leased. While 4 million sq. ft of available space under construction is a miniscule part of the market, it provides an opportunity to increase 2023 net absorption. It is unclear how lower import volumes and inventory will affect the market, but over-supply is unlikely and rent growth will remain robust.
Figure 4: Share of 2022 Leasing by Occupier Type

Note: Includes new leases and renewals 200,000 sq. ft. and above.
Source: CBRE Research, 2022.
Figure 5: Lease Transaction Volume by Size Range

Note: Includes new leases and renewals 200,000 sq. ft. and above.
Source: CBRE Research, 2022.
Figure 6: 2022 Construction Completions vs. Overall Net Absorption by Size Range

Source: CBRE Research, 2022.
Figure 7: Direct Vacancy Rate by Size Range

Source: CBRE Research, 2022.
Figure 8: Under Construction & Percentage Preleased

Source: CBRE Research, 2022.
Figure 9: First Year Taking Rents (psf/yr)
Note: Includes first year taking rents for leases 200,000 sq. ft. and above.
Source: CBRE Research, 2022.
Explore Big Box Insights by Market

Central Valley’s proximity to the affluent Bay Area gives it convenient access to more than 6.9 million people within a 50-mile radius.

Around 16.1 million people live within 50 miles of the IE’s core, the country’s second-largest industrial market population (behind Northern/Central New Jersey).

The Phoenix MSA is one of the fastest growing in North America, increasing demand for big-box industrial facilities and providing a growing labor pool.
Contacts
John Morris
Group President, Leasing, Advisory Services