Future Cities
2023 North America Industrial Big Box Review & Outlook: Phoenix
April 4, 2023 5 Minute Read

The Greater Phoenix industrial market is delivering strong results, with continued record net absorption and rental rate growth. Phoenix’s strategic geographic location, combined with its outstanding water, power and transportation infrastructure, make it a highly desirable market for all industry sectors. The labor supply is quite healthy with 50,000 annual college graduates and population growth of approximately 100,000 per year. We are confident that the Phoenix big-box market will remain strong this year.
Demographics
The Phoenix MSA is one of the fastest growing in North America, increasing demand for big-box industrial facilities and providing a growing labor pool. Close to 5 million people or 1.9 million households live within 50 miles of the city core, with an expected five-year growth rate of 4%. Nearly 25% of the population is aged 18-34.
Figure 1: Phoenix Population Analysis
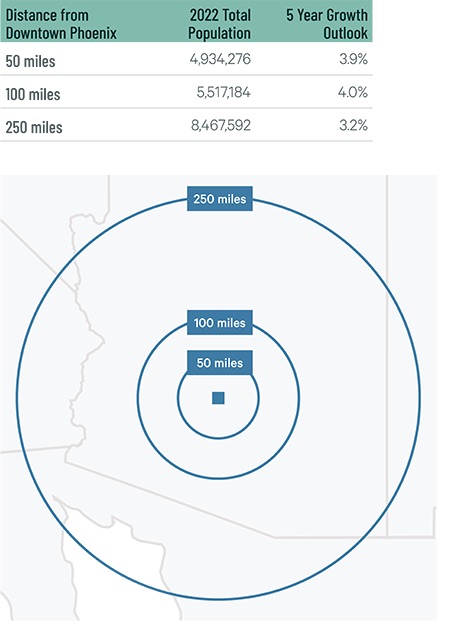
Source: CBRE Location Intelligence, Q4 2022.
The local warehouse labor force of 86,875 is expected to grow by 17.7% by 2032, the highest of any market in this report, according to CBRE Labor Analytics. The average wage for a non-supervisory warehouse employee is $17.83 per hour, 5.5% above the national average but 7.5% below the Inland Empire.
Figure 2: Phoenix Warehouse & Storage Labor Fundamentals
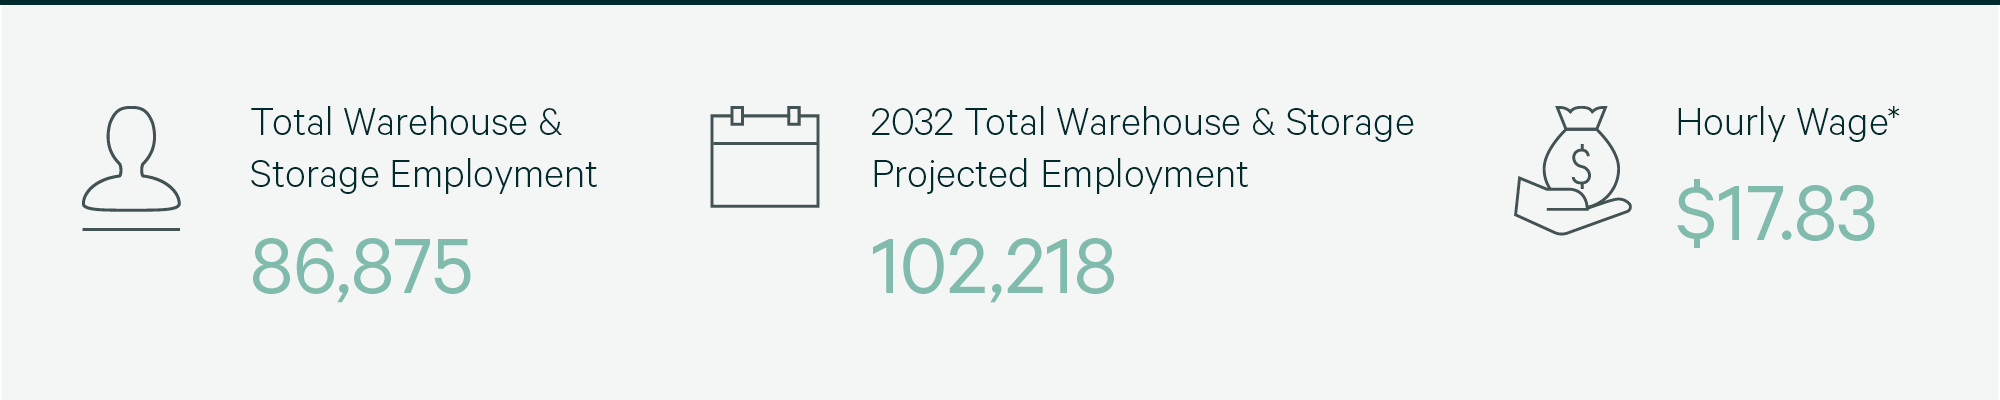
Source: CBRE Labor Analytics, Q4 2022.
*Median wage (1 year experience); non-supervisory warehouse material handlers.
Location Incentives
Over the past five years, there have been 217 publicly known economic incentives deals totaling over $508 million for an average of $10,154 per new job in metro Phoenix, according to Wavteq.
CBRE’s Location Incentives Group reports that the top incentive programs in metro Phoenix include the Arizona Competes Fund, offering discretionary grants to businesses that achieve certain performance measures and create new jobs with wages equal to or above the median county wage.
Another program available in metro Phoenix is the Quality Jobs Tax Credit Program, offering income tax credits up to $9,000 per job to generate high-quality employment opportunities in Arizona. The income tax credits are spread over three years to encourage continuous employment. To qualify, businesses must make a capital investment and create jobs that meet specific wage requirements. These tax credits are non-refundable and non-transferrable, and any unused credits may be carried forward for up to five consecutive years.
Figure 3: Phoenix Top Incentive Programs
Source: CBRE Location Incentives Group, Q4 2022.
Note: The extent, if any, of state and local incentive offerings depends on location and scope of the operation.
Logistics Driver
Approximately 130,000 miles of Arizona highways, including I-10, I-8 and I-40, make transportation of goods simple. Recent expansions and improvements were made to Loops 202 and 303.
Phoenix Sky Harbor International Airport (PHX) is a burgeoning air cargo hub utilized by FedEx, DHL and UPS. Cargo is processed in Phoenix’s two complexes, South Air Cargo and West Air Cargo. The Comprehensive Asset Management Plan for PHX includes new development to handle more air cargo in the coming years.

Approximately 130,000 miles of Arizona highways, including I-10, I-8 and I-40, make transportation of goods simple.
Capital Markets
Developers, tenants and institutional investors are attracted to Phoenix because of its limited government regulation, quality of life, affordability and abundant labor force. This has earned it a top-10 ranking for net absorption, rent growth, and construction volume. Land has retreated from record-high prices but continues to become scarcer, making infill sites highly coveted. Investors continue to seek industrial assets with near-term rollover to capture future growth, while longer-term leased assets are impacted by today’s interest rates. Despite increasing development this year, investor demand remains given Phoenix’s outsized performance and expected rental rate increases. It continues to benefit from the regulatory environment and low vacancies in Southern California.
Supply & Demand
Strong population growth and available first-generation space continues to attract big-box occupiers, with three consecutive years of over 10 million sq. ft. of lease transactions. Record-breaking leasing drove net absorption to over 20.7 million sq. ft., representing a growth rate of 14.3% (net absorption/existing inventory), the highest in North America. Demand in Phoenix continues to be driven by a diverse set of occupiers, led by 3PLs for the first time. They accounted for 34.1% of total leasing, far above the 21% rate in 2021.
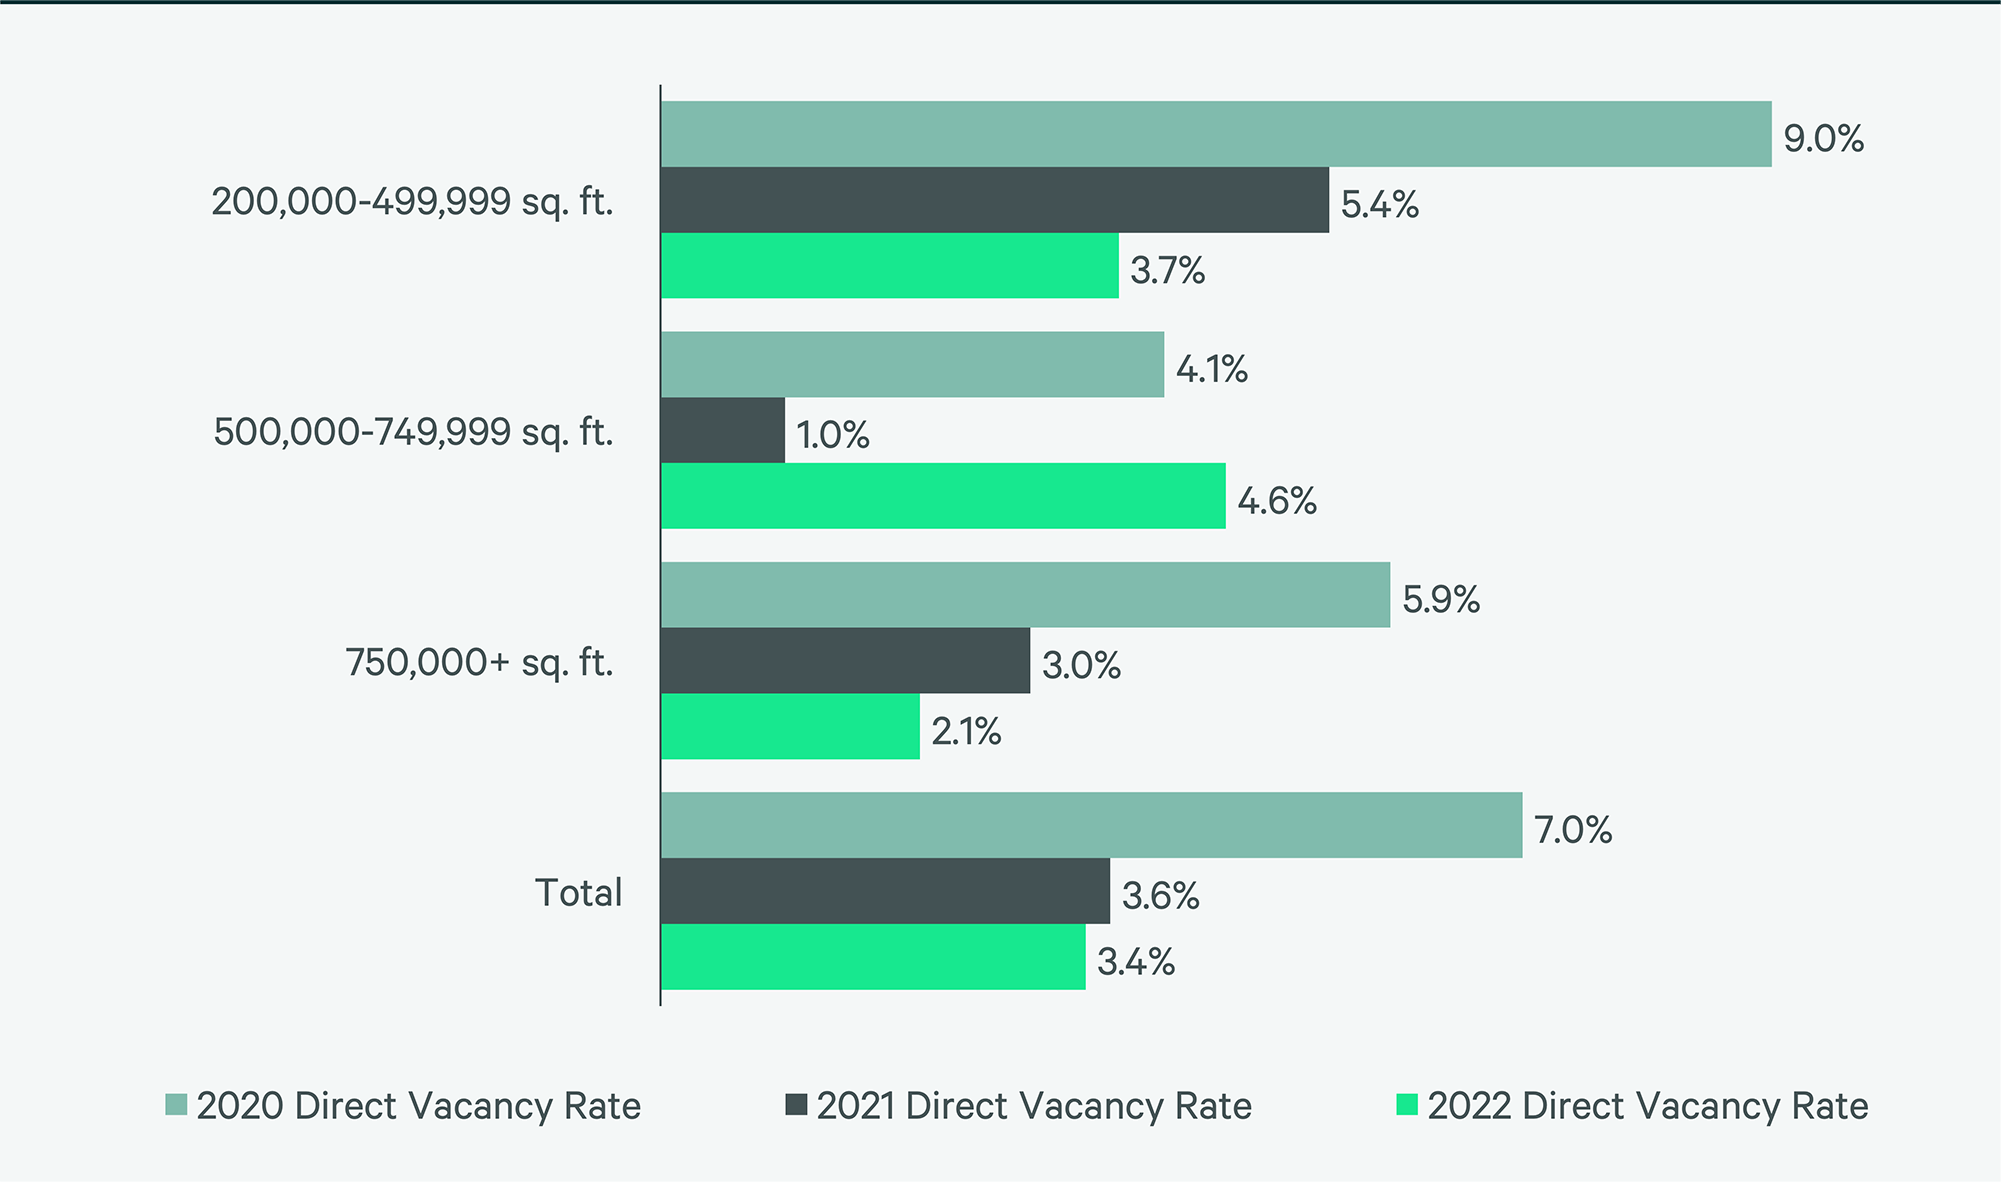
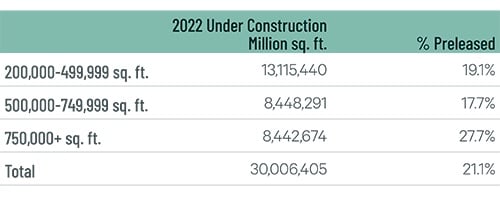
The direct vacancy rate declined to a record-low of 3.4% despite construction completions doubling to 20.5 million sq. ft. Low vacancies significantly pressured taking rents, which increased 33% year-over-year, the sixth-highest in North America. Record-low vacancies will modulate what could otherwise be oversupply, as 2023 sees another record-breaking year of development. Over 30 million sq. ft. of big-box product was under construction at year-end, with 21% pre-leased. Available under-construction product is five times the amount of available existing big-box product. While this will increase vacancy rates, continued demand from 3PLs, food & beverage, construction material, e-commerce retailers and projected reduction in ground-breakings will keep rent growth over 10% this year.
Figure 4: Share of 2022 Leasing by Occupier Type
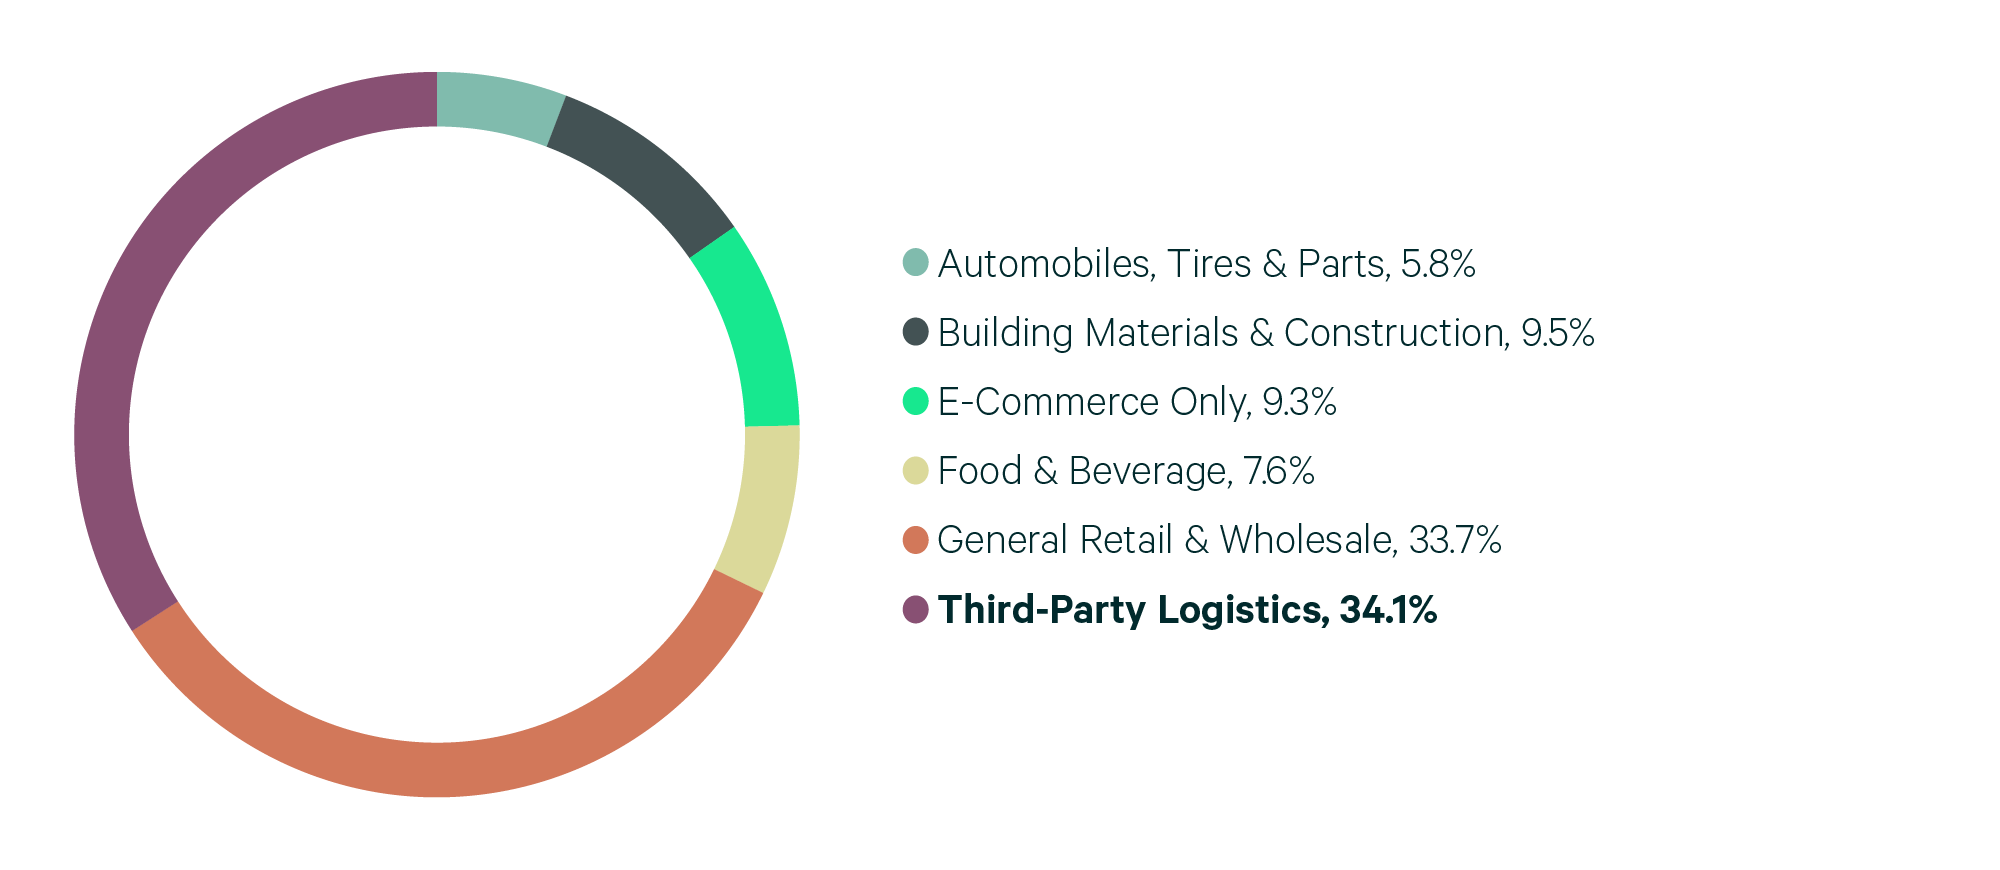
Note: Includes new leases and renewals 200,000 sq. ft. and above.
Source: CBRE Research, 2022.
Figure 5: Lease Transaction Volume by Size Range

Note: Includes new leases and renewals 200,000 sq. ft. and above.
Source: CBRE Research, 2022.
Figure 6: 2022 Construction Completions vs. Overall Net Absorption by Size Range
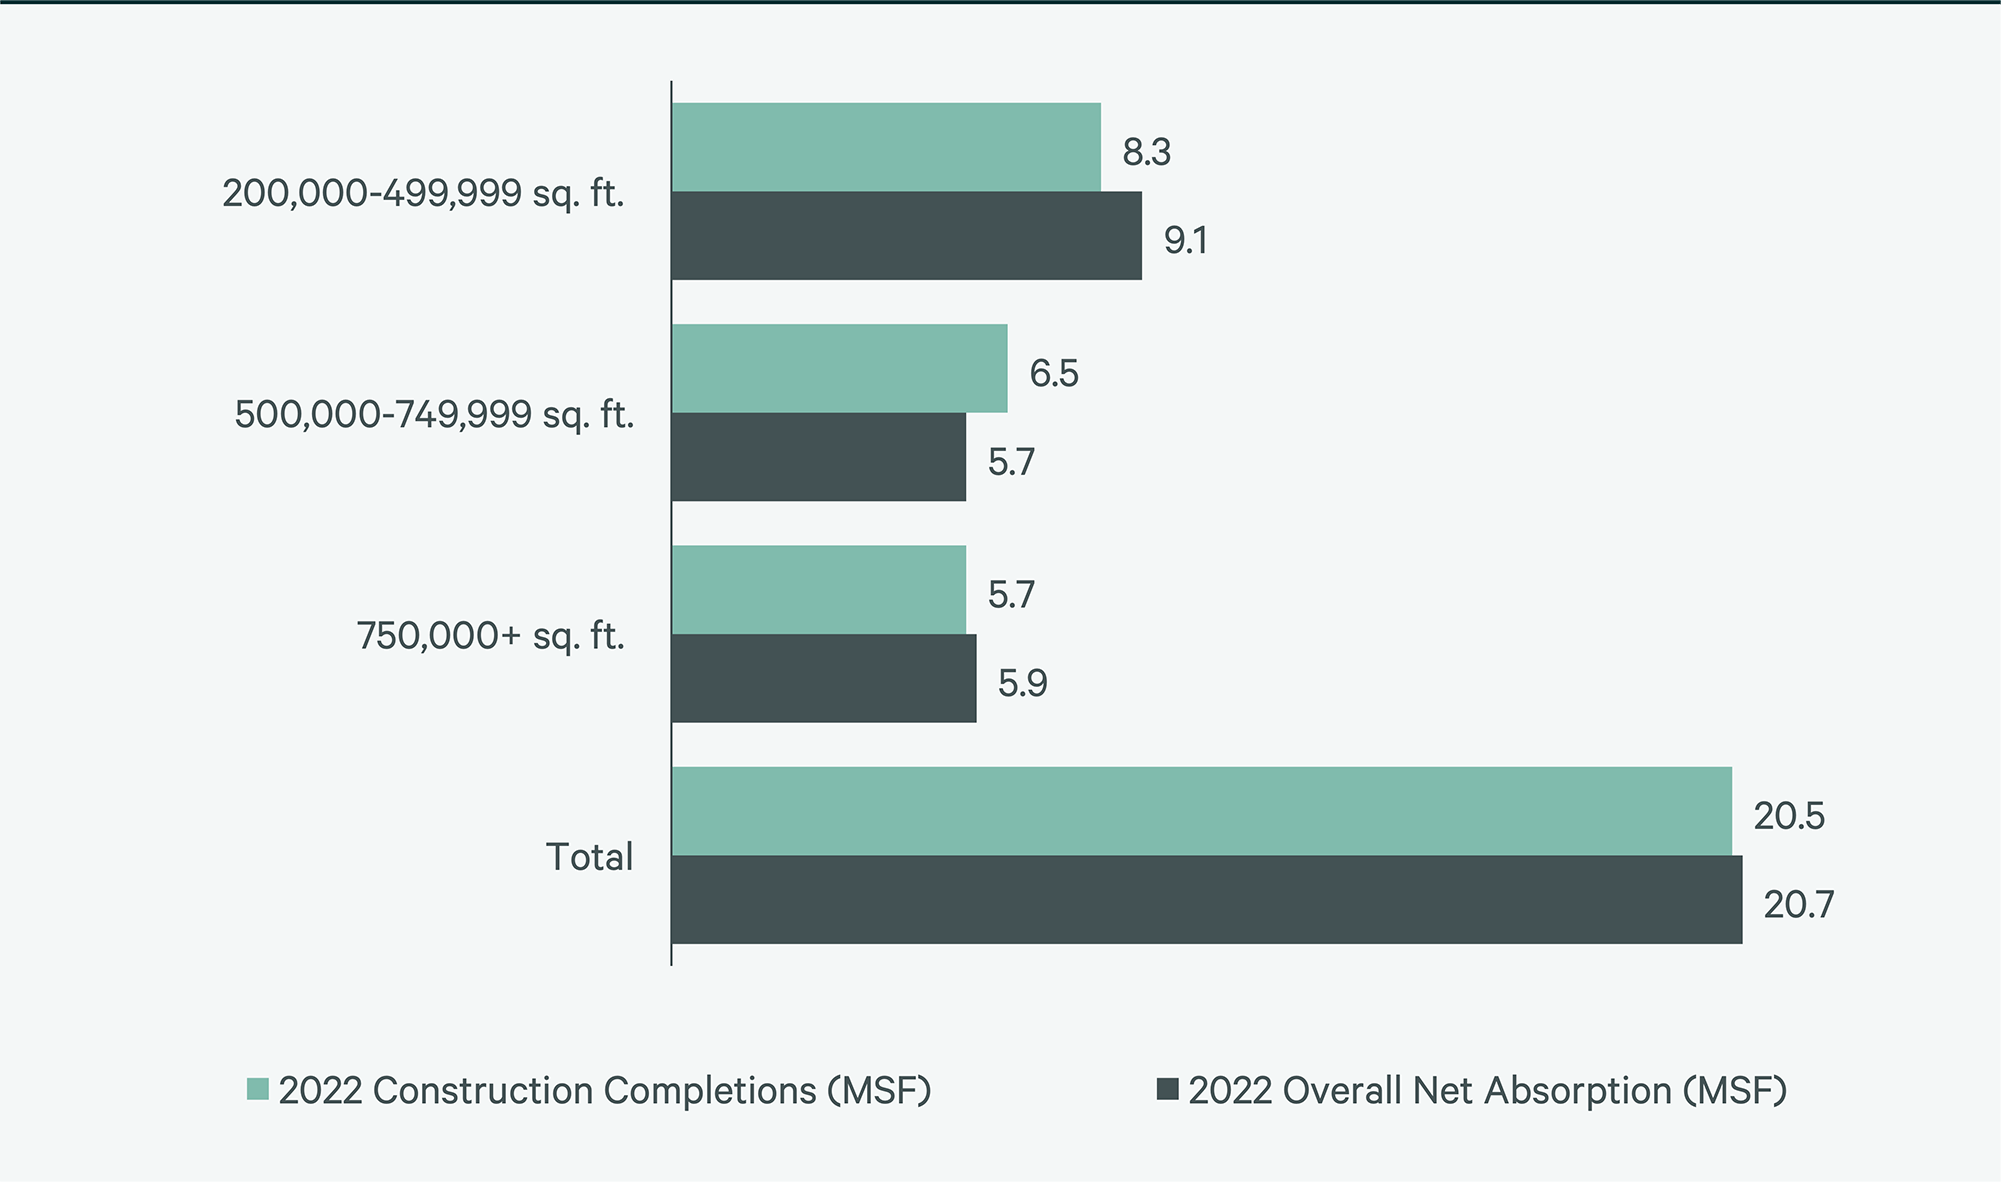
Source: CBRE Research, 2022.
Figure 7: 2021 Construction Completions vs. Overall Net Absorption
Source: CBRE Research, 2022.
Figure 8: Under Construction & Percentage Preleased
Source: CBRE Research, 2022.
Figure 9: First Year Taking Rents (psf/yr)
Note: Includes first year taking rents for leases 200,000 sq. ft. and above.
Source: CBRE Research, 2022.
Explore Big Box Insights by Market

Central Valley’s proximity to the affluent Bay Area gives it convenient access to more than 6.9 million people within a 50-mile radius.

Around 16.1 million people live within 50 miles of the IE’s core, the country’s second-largest industrial market population (behind Northern/Central New Jersey).

Over 15 million people live within 50 miles of the market core—the third most in the U.S. Nearly 26% of this population are aged 18-34.
Contacts
John Morris
Group President, Leasing, Advisory Services


