Future Cities
2023 North America Industrial Big Box Review & Outlook: Inland Empire
April 4, 2023 5 Minute Read

The Inland Empire (IE) remains the most in-demand big-box market because of multiple logistics drivers, its large population and robust labor force. Previously known as the low-cost alternative in Southern California, taking rents are now up over 60%, with minimal available land site inventory. These trends have expanded the IE’s borders into the High and Low Deserts, where occupiers can find more cost-efficient modern bulk space leases. Despite economic uncertainty, demand will remain strong in 2023 as Fortune 500 companies execute long-term plans to secure supply chain and inventory levels.
Demographics
Around 16.1 million people live within 50 miles of the IE’s core, the country’s second-largest industrial market population (behind Northern/Central New Jersey). The 18-34 age group accounts for 26% of the total population. The population is expected to decline by 0.7% over the next five years due to migration out of California. Within 250 miles, occupiers can reach almost 30 million consumers.
Figure 1: Inland Empire Population Analysis
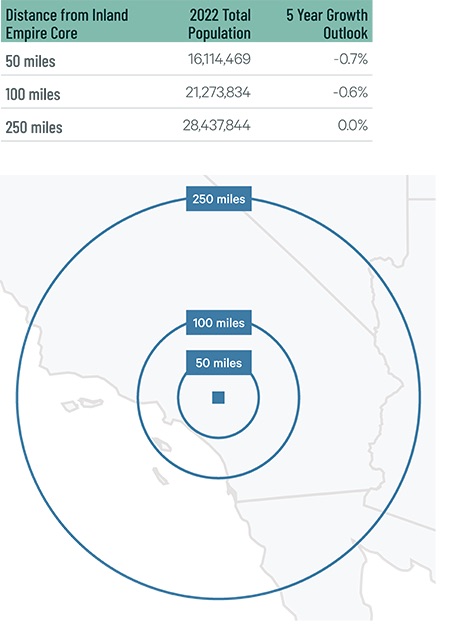
Source: CBRE Location Intelligence, Q4 2022.
The IE has a warehouse/distribution labor force over 140,000, which is forecast to grow by 17% over the next decade, according to CBRE Labor Analytics. The average hourly wage for a non-supervisory warehouse worker is $19.28 per hour. This is 14% above the national average, the lowest for a major California industrial market, and only 8.1% above Phoenix.
Figure 2: Inland Empire Warehouse & Storage Labor Fundamentals

Source: CBRE Labor Analytics, Q4 2022.
*Median wage (1 year experience); non-supervisory warehouse material handlers.
Location Incentives
Over the past five years, there have been 47 publicly known economic incentives deals totaling over $82 million for an average of $16,011 per new job in the IE, according to Wavteq.
CBRE’s Location Incentives Group reports that the top incentive programs in the IE include the California Competes Tax Credit, a discretionary income tax credit for businesses that make capital investments, create new jobs, and offer strategic importance to the region. The credits are non-refundable, and companies can only apply during designated application periods held three times per year. This program was extended through 2023 with $180 million in tax credits.
Figure 3: Inland Empire Top Incentive Programs
Source: CBRE Location Incentives Group, Q4 2022.
Note: The extent, if any, of state and local incentive offerings depends on location and scope of the operation.
Logistics Driver
The market is close to North America’s largest ports, in Los Angeles and Long Beach. Despite a significant import volume decline in 2022, the flow of imports into these ports directly feeds the region’s big-box distribution warehouses.
The market has logistics advantages from the air, ground and rail. Ontario International now ranks as a top-10 North American cargo airport by growth and volume. Ground transportation is a key to the market’s success. Interstates 10 and 15 offer direct access to the rest of the country. Also, BNSF and Union Pacific service the market with rail.

Ontario International now ranks as a top-10 North American cargo airport by growth and volume.
Capital Markets
Despite H2 headwinds, 2022 was another record year for the IE. Market fundamentals remain very strong, with the country’s highest year-over-year rent growth. Assets with significant below-market rents and under three years of Weighted Average Lease Term have traded at sub-4% cap rates. Today’s debt market influences pricing for at-market longer-term leased assets. Given its outsized performance, the industrial sector remains debt and equity capital’s target sector.
Supply & Demand
The IE is experiencing the largest rent growth of any big-box market on record. First-year base rents finished 2022 at $14.49 PSF per year, 60.3% above year-end 2021. Rent growth can be attributed to a lack of existing vacant space. Only 0.1% of existing space was vacant by year-end 2022, the lowest in Northern America. Leasing finished at a robust 46.7 million sq. ft., despite almost no vacant space, driven by product under construction and renewals. Although lower than 2021, it was by far the most in North America.
While the amount of space under construction doubled in 2022, a 55% pre-lease rate indicates there is still minimal first-generation space coming onto the market. Vacancy rates will remain below 1% for the foreseeable future because of this and a projected decline in construction starts. This projection is due to a hold on construction financing and pushback against new industrial development from many municipalities.
Figure 4: Share of 2022 Leasing by Occupier Type

Note: Includes new leases and renewals 200,000 sq. ft. and above.
Source: CBRE Research, 2022.
Figure 5: Lease Transaction Volume by Size Range

Note: Includes new leases and renewals 200,000 sq. ft. and above.
Source: CBRE Research, 2022.
Figure 6: 2022 Construction Completions vs. Overall Net Absorption by Size Range

Source: CBRE Research, 2022.
Figure 7: Direct Vacancy Rate by Size Range

Source: CBRE Research, 2022.
Figure 8: Under Construction & Percentage Preleased
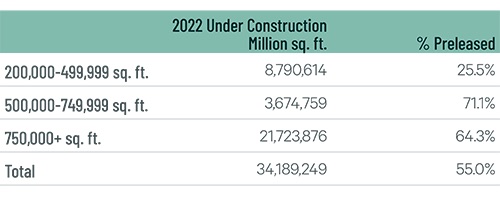
Source: CBRE Research, 2022.
Figure 9: First Year Taking Rents (psf/yr)
Note: Includes first year taking rents for leases 200,000 sq. ft. and above.
Source: CBRE Research, 2022.
Explore Big Box Insights by Market

Central Valley’s proximity to the affluent Bay Area gives it convenient access to more than 6.9 million people within a 50-mile radius.

Over 15 million people live within 50 miles of the market core—the third most in the U.S. Nearly 26% of this population are aged 18-34.

The Phoenix MSA is one of the fastest growing in North America, increasing demand for big-box industrial facilities and providing a growing labor pool.
Contacts
John Morris
Group President, Leasing, Advisory Services


