Future Cities
2023 North America Industrial Big Box Review & Outlook: Puget Sound
April 4, 2023 5 Minute Read

Demand from tenants and investors for industrial space in the Puget Sound market remains robust. Current tenants generally elect to renew their leases, especially in prime locations close to ports and urban centers. Prospecting tenants tend to target properties along the highly desirable I-5 corridor. Despite today’s higher interest rates, investors remain attracted to Puget Sound’s low vacancy, rising rents, good economic fundamentals and population projections.
Demographics
More than 4.8 million people live within 50 miles of the urban core, with an expected 2.5% five-year growth rate—the highest of any major West Coast market. More than 11 million people live within 250 miles, with a 2.3% expected growth rate in five years. A total of 4.3 million households can be reached within 250 miles.
Figure 1: Puget Sound Population Analysis

Source: CBRE Location Intelligence, Q4 2022.
The local warehouse labor force of over 62,405 is expected to grow 8.5% by 2032, according to CBRE Labor Analytics. Seattle has the highest non-supervisory wage of any market in this report at $21.71 per hour, 28.4% above the national average.
Figure 2: Puget Sound Warehouse & Storage Labor Fundamentals

Source: CBRE Labor Analytics, Q4 2022.
*Median wage (1 year experience); non-supervisory warehouse material handlers.
Location Incentives
Over the past five years, there have been 19 publicly known economic incentives deals totaling $19 million for an average of $8,657 per new job in metro Seattle, according to Wavteq.
CBRE’s Location Incentives Group reports that top incentive programs offered in metro Seattle include a sales and use tax exemption for machinery and equipment. This is used directly in manufacturing, warehouse or research and development operations. Service charges are also tax-exempt for installing, repairing, improving or cleaning the machinery and equipment.
Figure 3: Puget Sound Top Incentive Programs
Source: CBRE Location Incentives Group, Q4 2022.
Note: The extent, if any, of state and local incentive offerings depends on location and scope of the operation.
Logistics Driver
The Northwest Seaport Alliance, which includes the ports of Seattle and Tacoma, is the U.S.’s fifth-largest container gateway. The ports are less congested than their California counterparts and provide a shorter direct route to Asia. Union Pacific and BNSF rail lines link the ports to the Midwest Seattle-Tacoma International Airport hosts 24 air carriers and I-5 passes through the region, providing direct access to the entire West Coast.

The Northwest Seaport Alliance, which includes the ports of Seattle and Tacoma, is the U.S.'s fifth-largest container gateway.
Capital Markets
Since the price of debt ultimately effects the price of equity, capital is looking for positive leverage, but is willing to tolerate negative leverage for a couple years to buy the best product in the best locations. This was evidenced by two sales in the Kent Valley market: Renton Logistics and Pacific Gateway. Both sold at a low-4% range cap rate, with rents well below current market rates. CBRE projects more investment activity by Q2 2023, and robust activity to resume in H2 2023.
Supply & Demand
Puget Sound was one of the few big-box markets to post year-over-year lease transaction growth, reaching 8 million sq. ft. leased, 12% above 2021. 50% of the market’s lease activity was from 3PLs. Puget Sound also had one of the highest percentages of total leasing from the food & beverage sector, at 11.8%. Robust leasing created 4.4 million sq. ft. of positive absorption, lowering vacancy rates to 2.9%, an almost 50% year-over-year decline.
Over one million sq. ft. is under construction (a record) and almost 40% is pre-leased. Also, construction starts are projected to slow, further lowering vacancy rates. CBRE projects 2023 will see double-digit rent growth.
Figure 4: Share of 2022 Leasing by Occupier Type
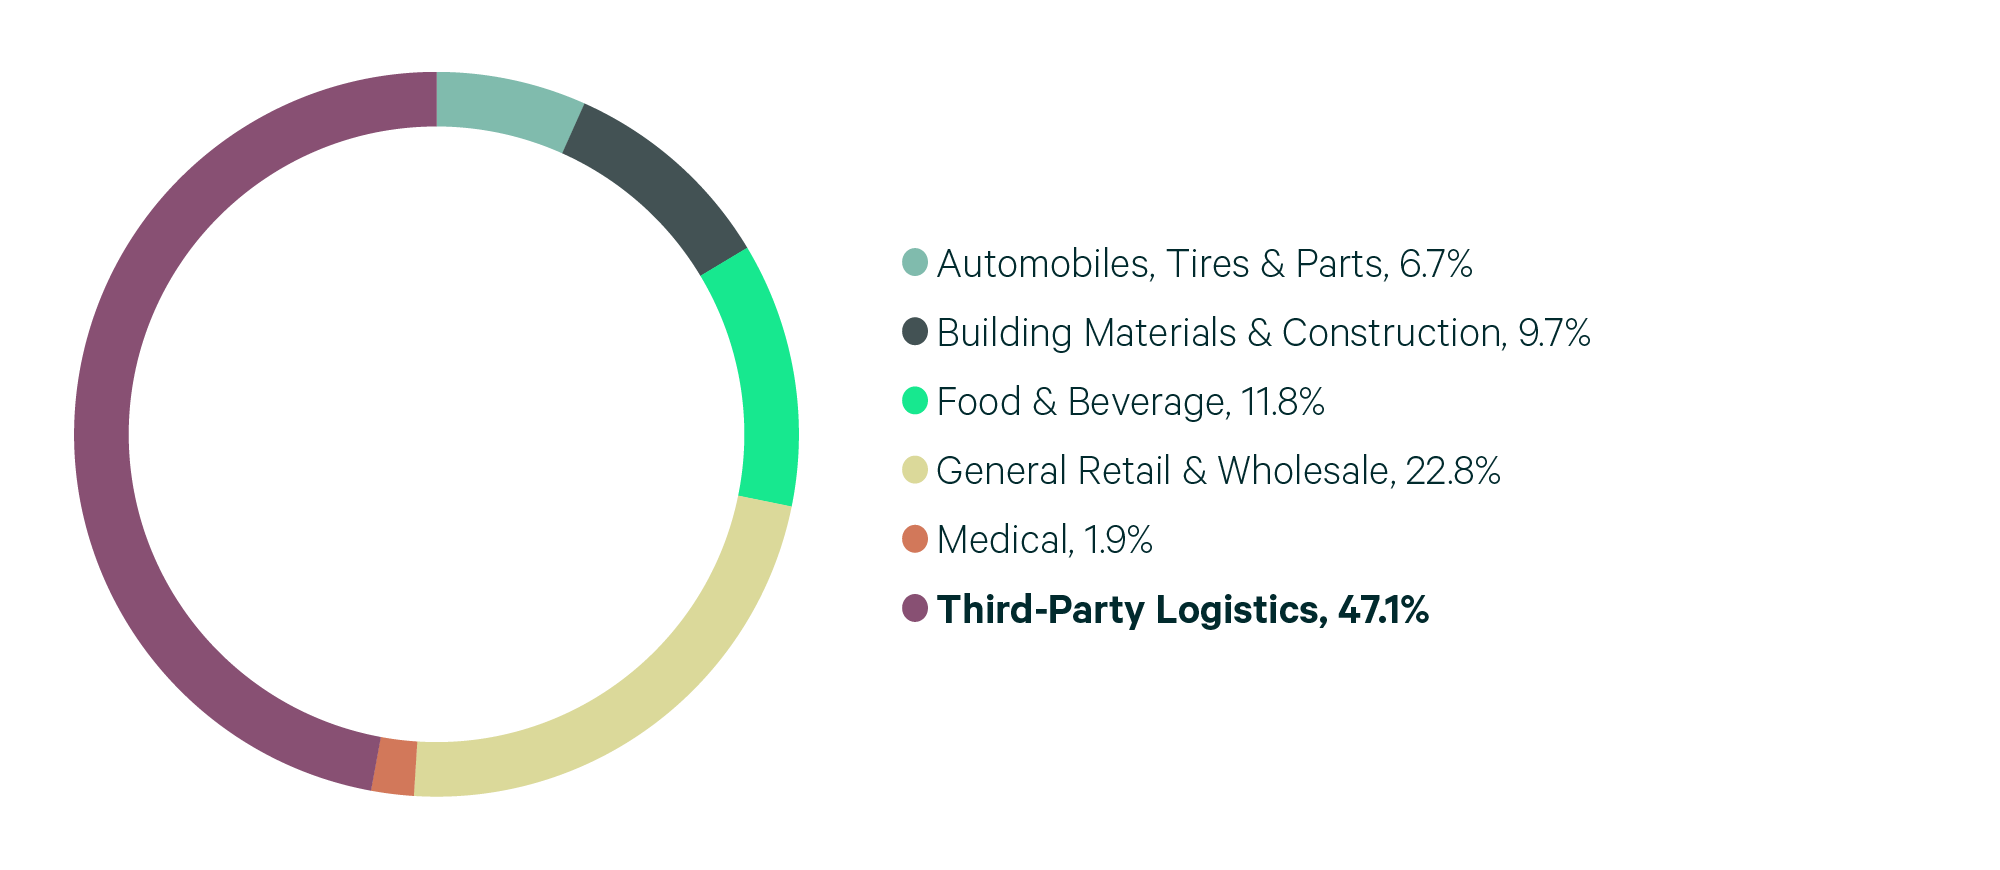
Note: Includes new leases and renewals 200,000 sq. ft. and above.
Source: CBRE Research, 2022.
Figure 5: Lease Transaction Volume by Size Range

Note: Includes new leases and renewals 200,000 sq. ft. and above.
Source: CBRE Research, 2022.
Figure 6: 2022 Construction Completions vs. Overall Net Absorption by Size Range
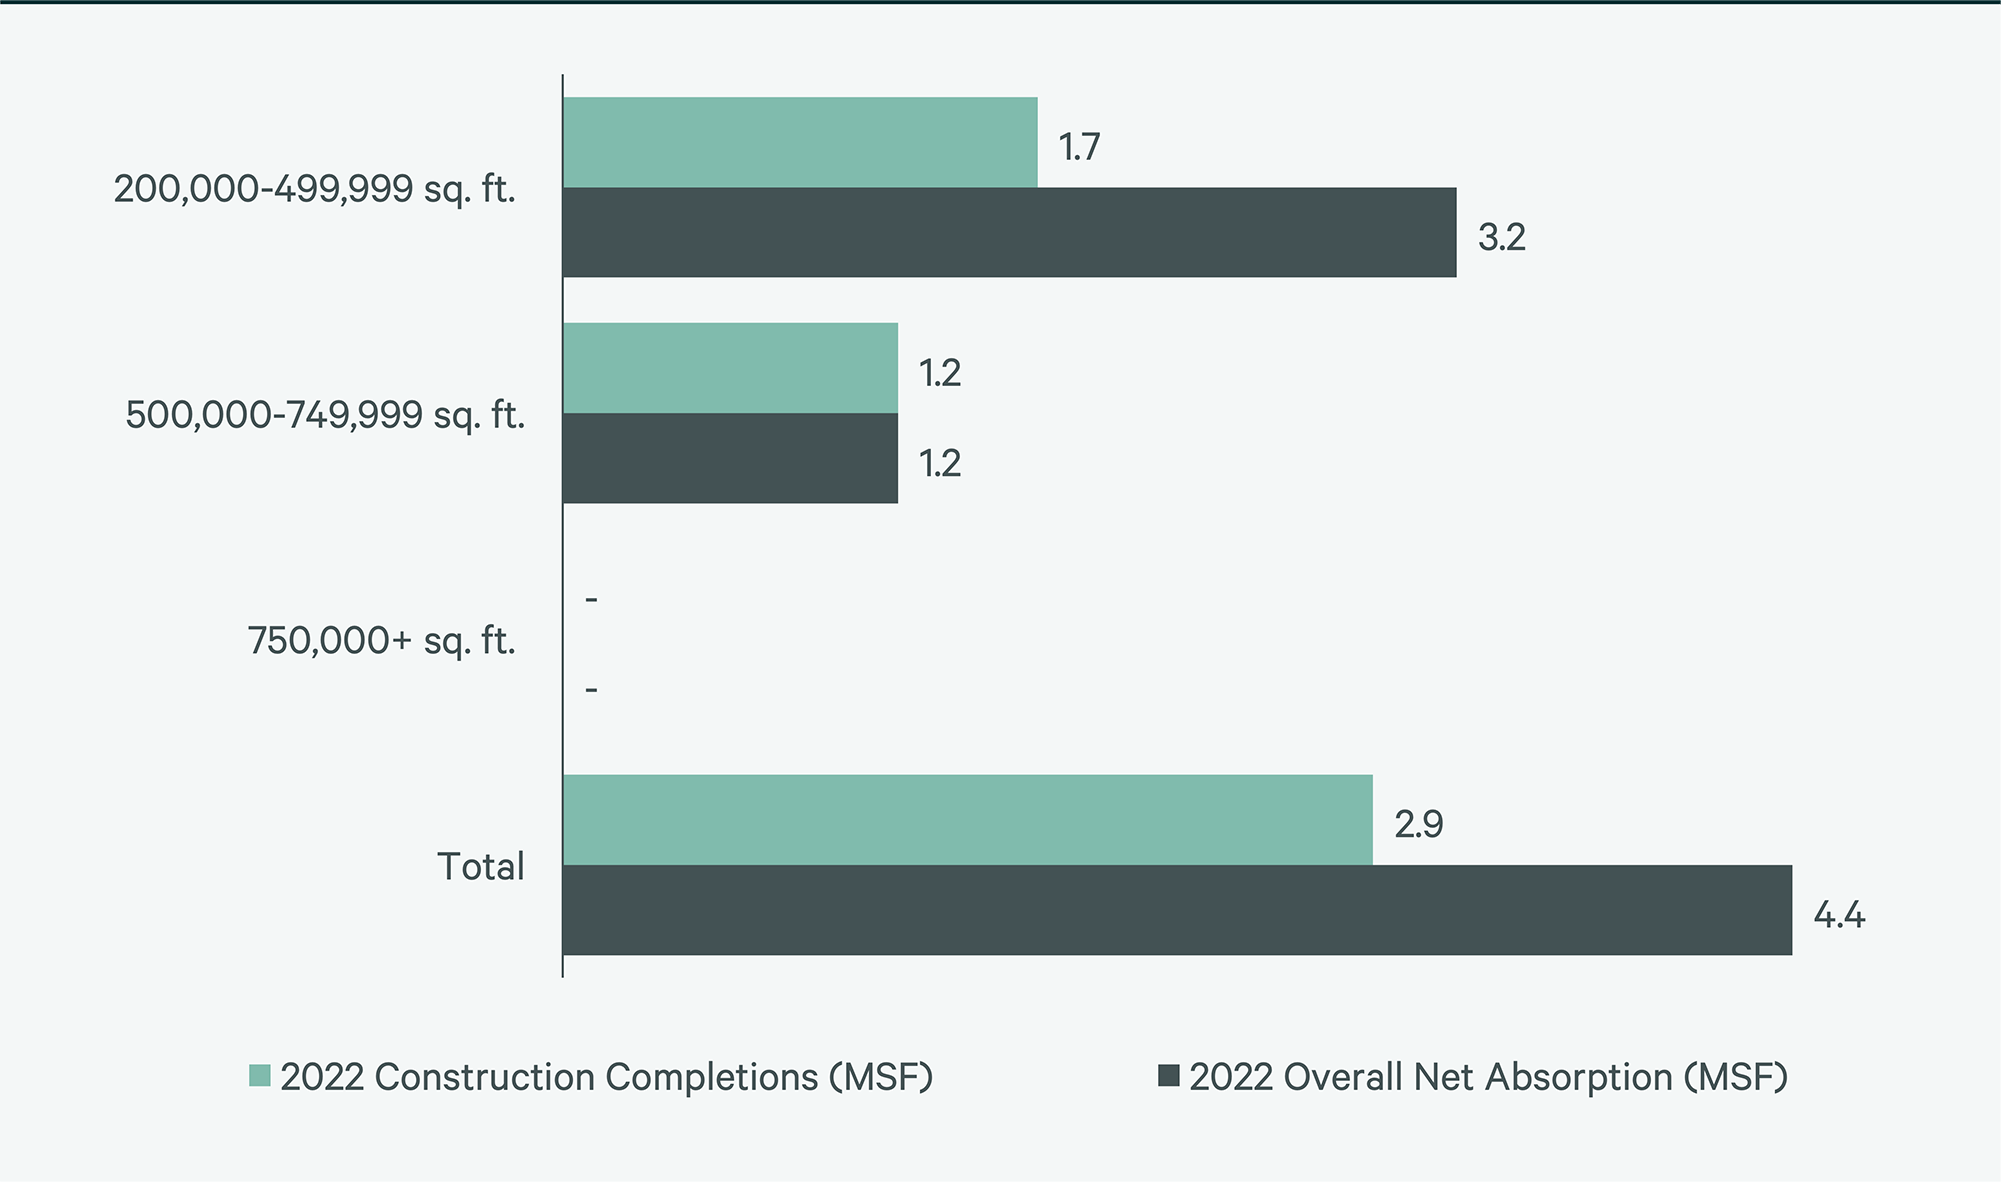
Source: CBRE Research, 2022.
Figure 7: Direct Vacancy Rate by Size Range
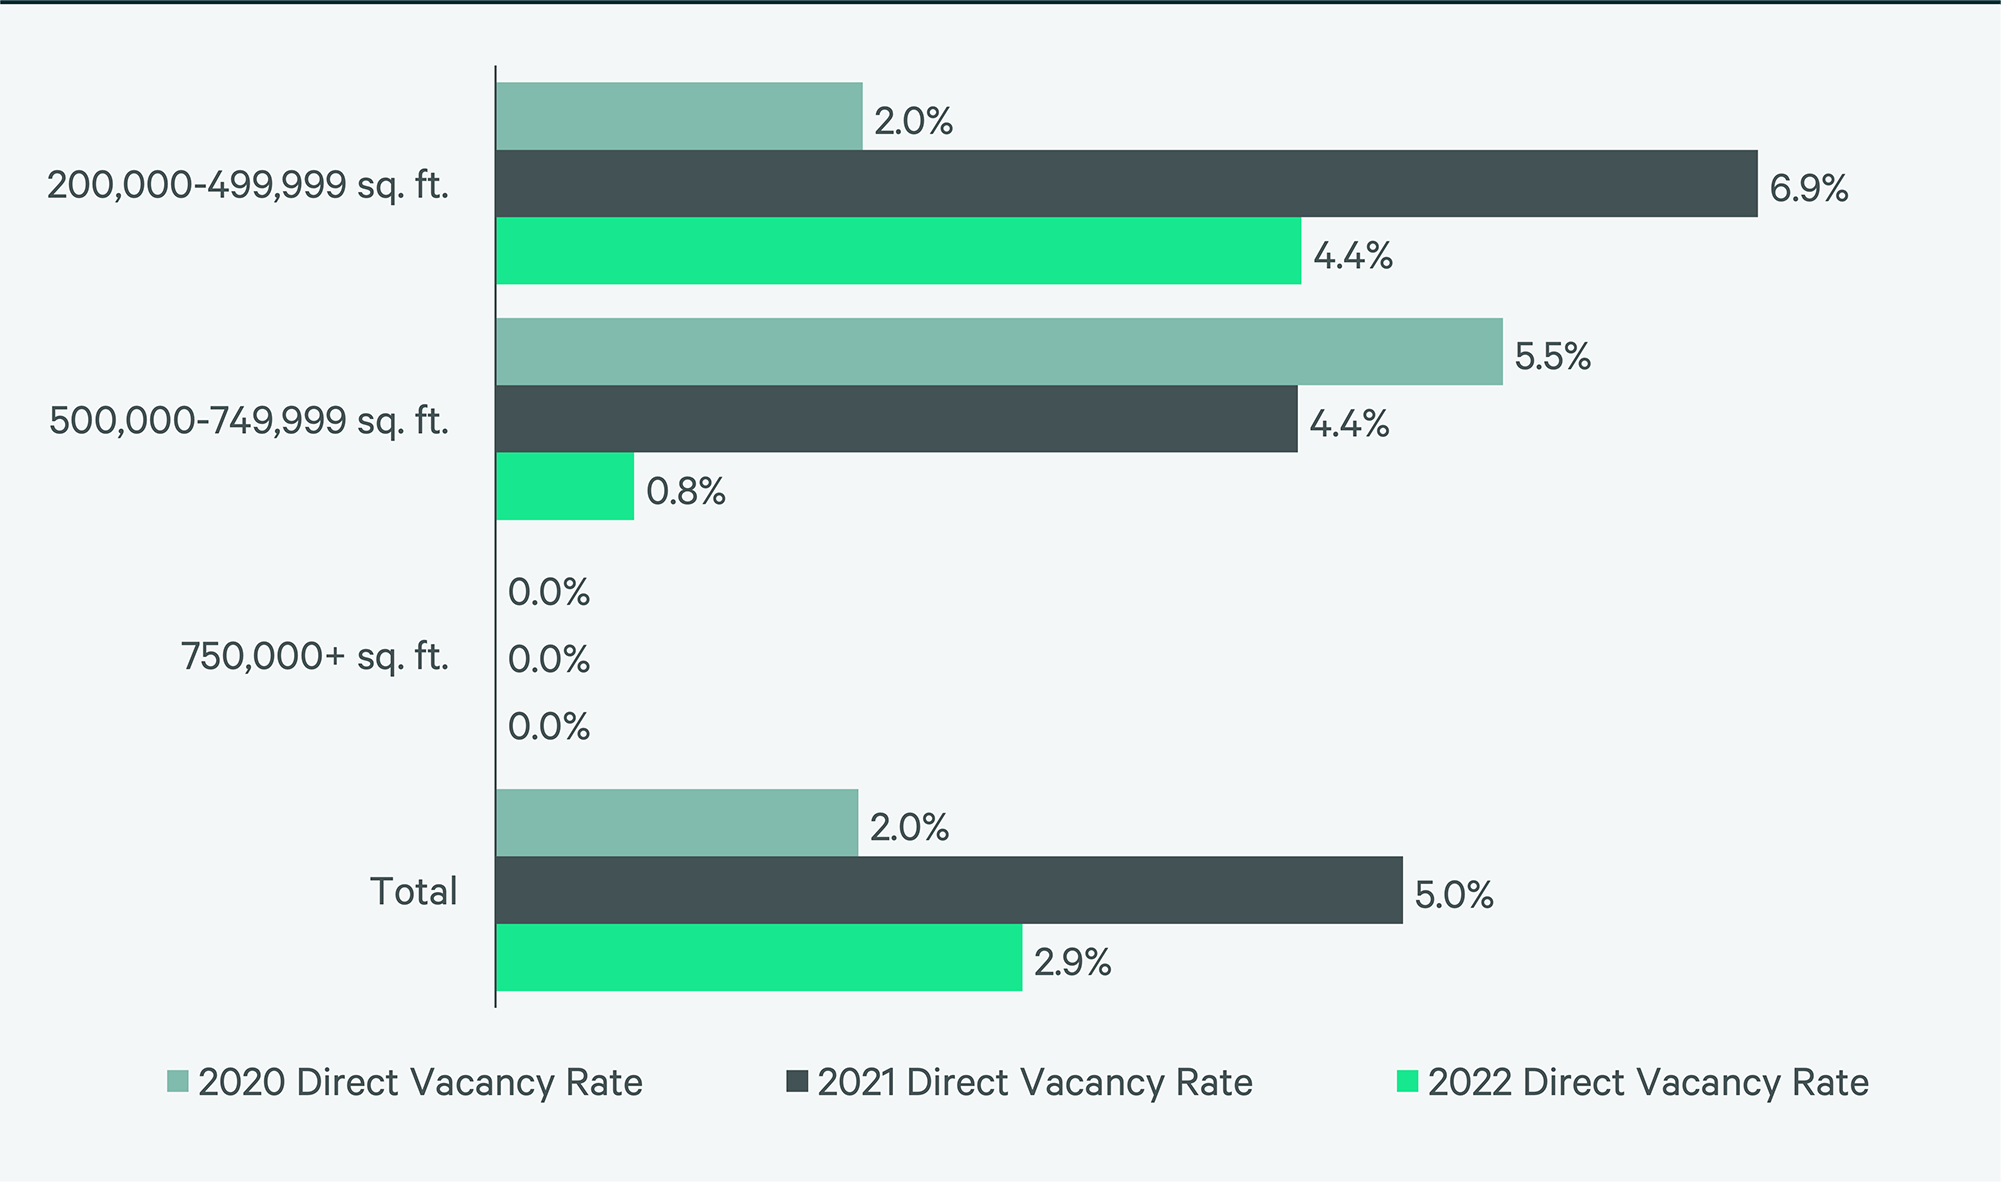
Source: CBRE Research, 2022.
Figure 8: Under Construction & Percentage Preleased
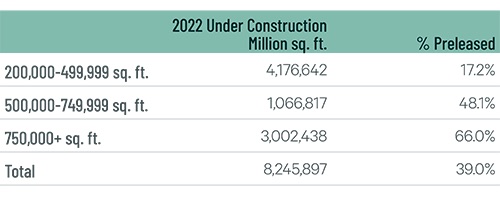
Source: CBRE Research, 2022.
Figure 9: First Year Taking Rents (psf/yr)
Note: Includes first year taking rents for leases 200,000 sq. ft. and above.
Source: CBRE Research, 2022.
Explore Big Box Insights by Market

Central Valley’s proximity to the affluent Bay Area gives it convenient access to more than 6.9 million people within a 50-mile radius.

Around 16.1 million people live within 50 miles of the IE’s core, the country’s second-largest industrial market population (behind Northern/Central New Jersey).

Over 15 million people live within 50 miles of the market core—the third most in the U.S. Nearly 26% of this population are aged 18-34.
Contacts
John R. Miller
Executive Managing Director

John Morris
Group President, Advisory Leasing


