Future Cities
Central Valley, California
2024 North America Industrial Big-Box Review & Outlook
April 29, 2024 5 Minute Read

Demographics
Central Valley’s proximity to the affluent Bay Area gives it convenient access to more than 5.3 million people within 50 miles of the market’s core. Within 250 miles, the market reaches 18 million people, with 25% aged 18-34.
Figure 1: Central Valley Population Analysis

The local warehouse labor force of 31,142 is expected to grow by 17.8% by 2034, according to CBRE Labor Analytics. The average wage for a non-supervisory warehouse worker is $20.93 per hour, 18% above the national average.
Figure 2: Central Valley Warehouse & Storage Labor Fundamentals

*Median wage (1 year experience); non-supervisory warehouse material handlers.
Location Incentives
Over the past five years, there have been over 130 economic incentives deals totaling more than $255 million for an average of $21,800 per new job in metro Central Valley, according to fDi Intelligence.
CBRE’s Location Incentives Group reports that top incentive programs in Central Valley include the California Competes Tax Credit, a discretionary income tax credit for businesses that locate or expand in California. This program was extended to have $120 million in tax credits available through 2028, for allocation to businesses that make capital investments, create new jobs and offer strategic importance to the region. The credits are non-refundable and companies can only apply during designated application.
Figure 3: Central Valley Top Incentive Programs
Note: The extent, if any, of state and local incentive offerings depends on location and scope of the operation.
Logistics Driver
The Central Valley is one of the most rail-friendly logistics regions in California, served by two major lines: BNSF and Union Pacific. Fresno Yosemite International Airport provides daily cargo services by FedEx and UPS. The region’s top logistics advantage may be the Port of Stockton, which is served by four major freeways, two transcontinental railroads, an international waterway and a regional airport. The port boasts first-class warehouse storage and handling facilities for both dry and liquid bulk materials, facilities and equipment to handle break-bulk and containerized cargo by land or sea.

The port boasts first-class warehouse storage and handling facilities for both dry and liquid bulk materials, facilities and equipment to handle break-bulk and containerized cargo by land or sea.
Supply & Demand
Central Valley remained one of North America’s better performing big-box markets due to its central location in California and affordable rental rates. Transaction volume totaled 11.7 million sq. ft. in 2023, making it one of the few markets in this report that had a year-over-year increase in lease volume, with demand evenly distributed throughout different size ranges. Despite more leasing, net absorption decreased to 3.7 million sq. ft. This decline, along with 5.3 million sq. ft. of construction completions, pushed up vacancy rates to 6.7%, about double last year’s 3.3%. Demand was dominated by the food & beverage sector, which accounted for 58% of total transaction volume. First-year taking rents increased by 11.4% to $7.84 per sq. ft., which remains the lowest taking rent of any California market.
There was a significant decrease in construction projects due to macroeconomic challenges in construction financing. By year-end 2023, only 3.9 million sq. ft. was under construction, with 43% of it preleased. The low levels of available under construction space will help stabilize vacancy rates and could lead to vacancy reductions by H2 2024. Lower vacancies will keep rental rates rising in the coming quarters.
Figure 4: Share of 2023 Leasing by Occupier Type
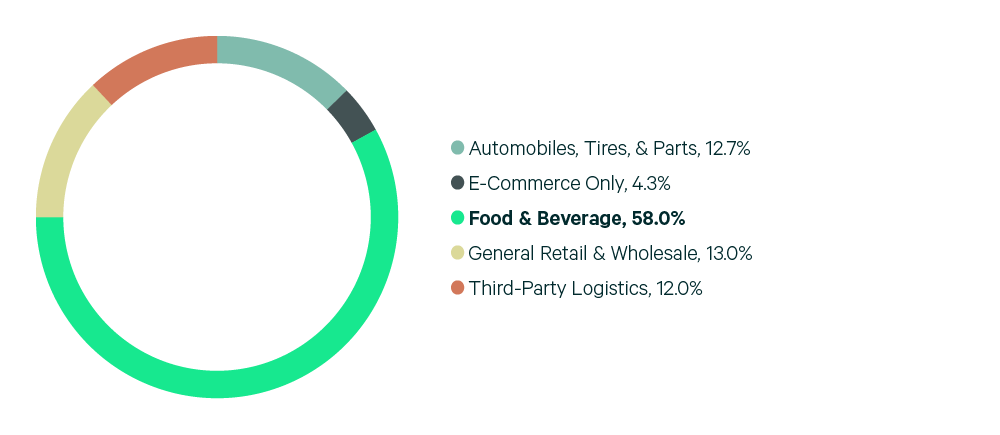
Source: CBRE Research.
Figure 5: Lease Transaction Volume by Size Range
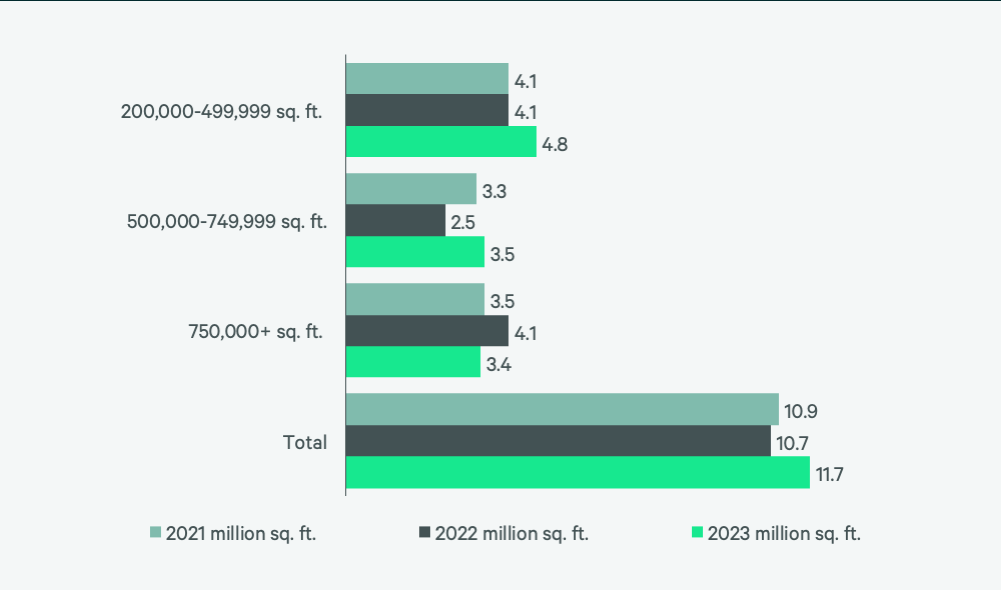
Source: CBRE Research.
Figure 6: 2023 Construction Completions vs. Overall Net Absorption by Size Range
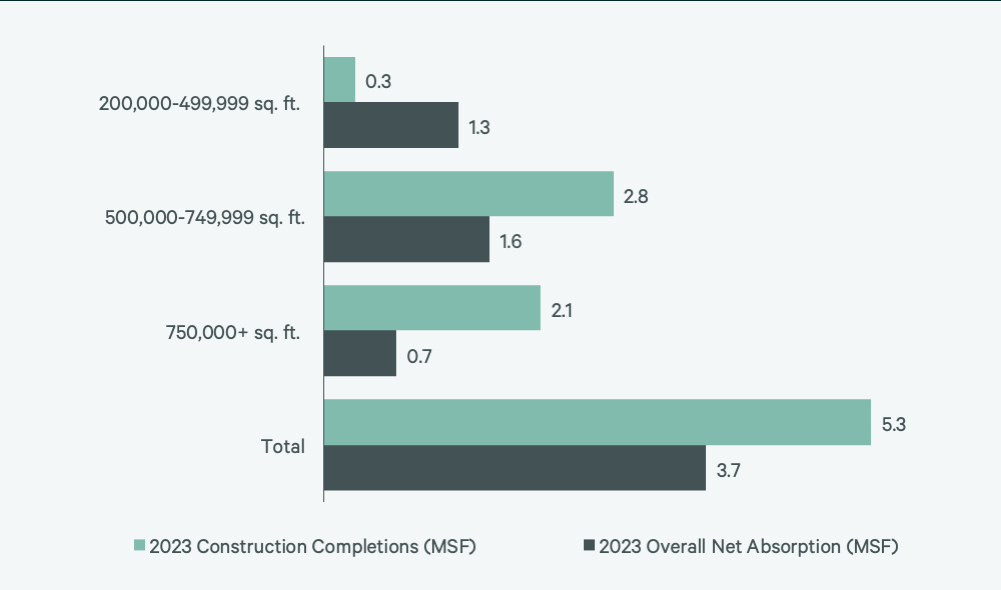
Figure 7: Direct Vacancy Rate by Size Range

Figure 8: Under Construction & Percentage Preleased
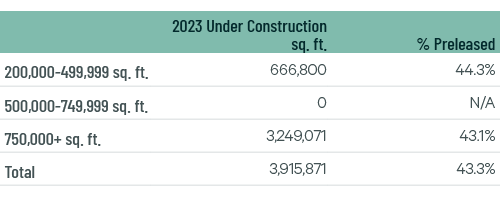
Figure 9: First Year Taking Rents (psf/yr)
Source: CBRE Research.
Explore Big-Box Insights by Market
-

Around 11.9 million people live within 50 miles of the market’s core, the third-most of any U.S. market in this report, with a projected 0.4% five-year growth rate.
-

Over 15 million people live within 50 miles of the market’s core—the second-largest population of any U.S. market in this report, with a flat expected five-year growth rate.
-

Phoenix has been one of the country’s fastest-growing metros.


