Future Cities
Los Angeles County
2024 North America Industrial Big-Box Review & Outlook
April 29, 2024 5 Minute Read

Demographics
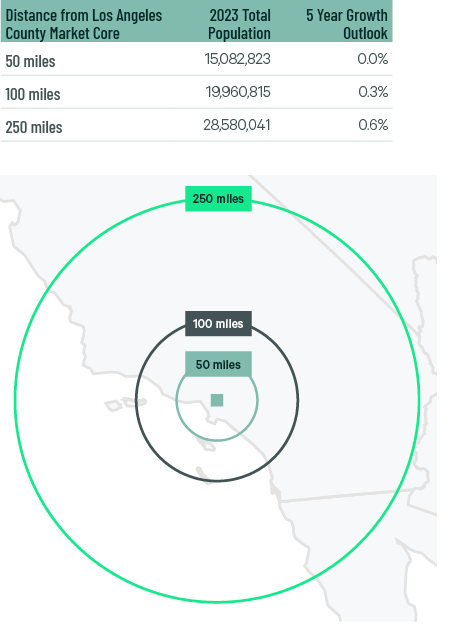
Over 15 million people live within 50 miles of the market’s core—the second-largest population of any U.S. market in this report, with a flat expected five-year growth rate. Nearly 29 million people live within 250 miles, with a 0.7% projected five-year growth rate.
Figure 1: Los Angeles County Population Analysis
The local warehouse labor force of 225,281 is the U.S.’s third-largest and is expected to grow by 4.9% by 2034, according to CBRE Labor Analytics. The region has a high cost of living and one of the highest average wages for a non-supervisory warehouse worker: $20.88—17.7% above the national average.
Figure 2: Los Angeles County Warehouse & Storage Labor Fundamentals

*Median wage (1 year experience); non-supervisory warehouse material handlers.
Location Incentives
Over the past five years, there have been over 280 economic incentives deals totaling more than $500 million for an average of $20,500 per new job in metro Los Angeles, according to fDi Intelligence.
CBRE’s Location Incentives Group reports that top incentive programs offered in Los Angeles County include the California Competes Tax Credit, a discretionary income tax credit for businesses that locate to or expand in California. This program was extended through 2028 with $120 million in tax credits for businesses that make capital investments, create new jobs and offer strategic importance to the state. The credits are non-refundable and applications are only open three times per year.
Figure 3: Los Angeles County Top Incentive Programs
Note: The extent, if any, of state and local incentive offerings depends on location and scope of the operation.
Logistics Driver
Los Angeles County contains North America‘s two largest seaports and one of the country’s top five air cargo hubs. Imports and exports flowing through the ports of Los Angeles and Long Beach directly feed the region’s big-box distribution centers. Imports declined year-over-year in 2023 due to less demand for new inventory. Despite the decline, these ports will remain the country’s most active for years to come.
Los Angeles International (LAX) is the U.S.’s fifth-busiest air cargo airport. LAX is a convenient and efficient major air cargo distribution center because of available vital allied services, especially for Pacific Rim traders. The regional cargo trade also engages more than 800 freight forwarders and 360 customs house brokers, who expedite the region’s air cargo delivery.

Imports declined year-over-year in 2023 due to less demand for new inventory. Despite the decline, these ports will remain the country’s most active for years to come.
Supply & Demand
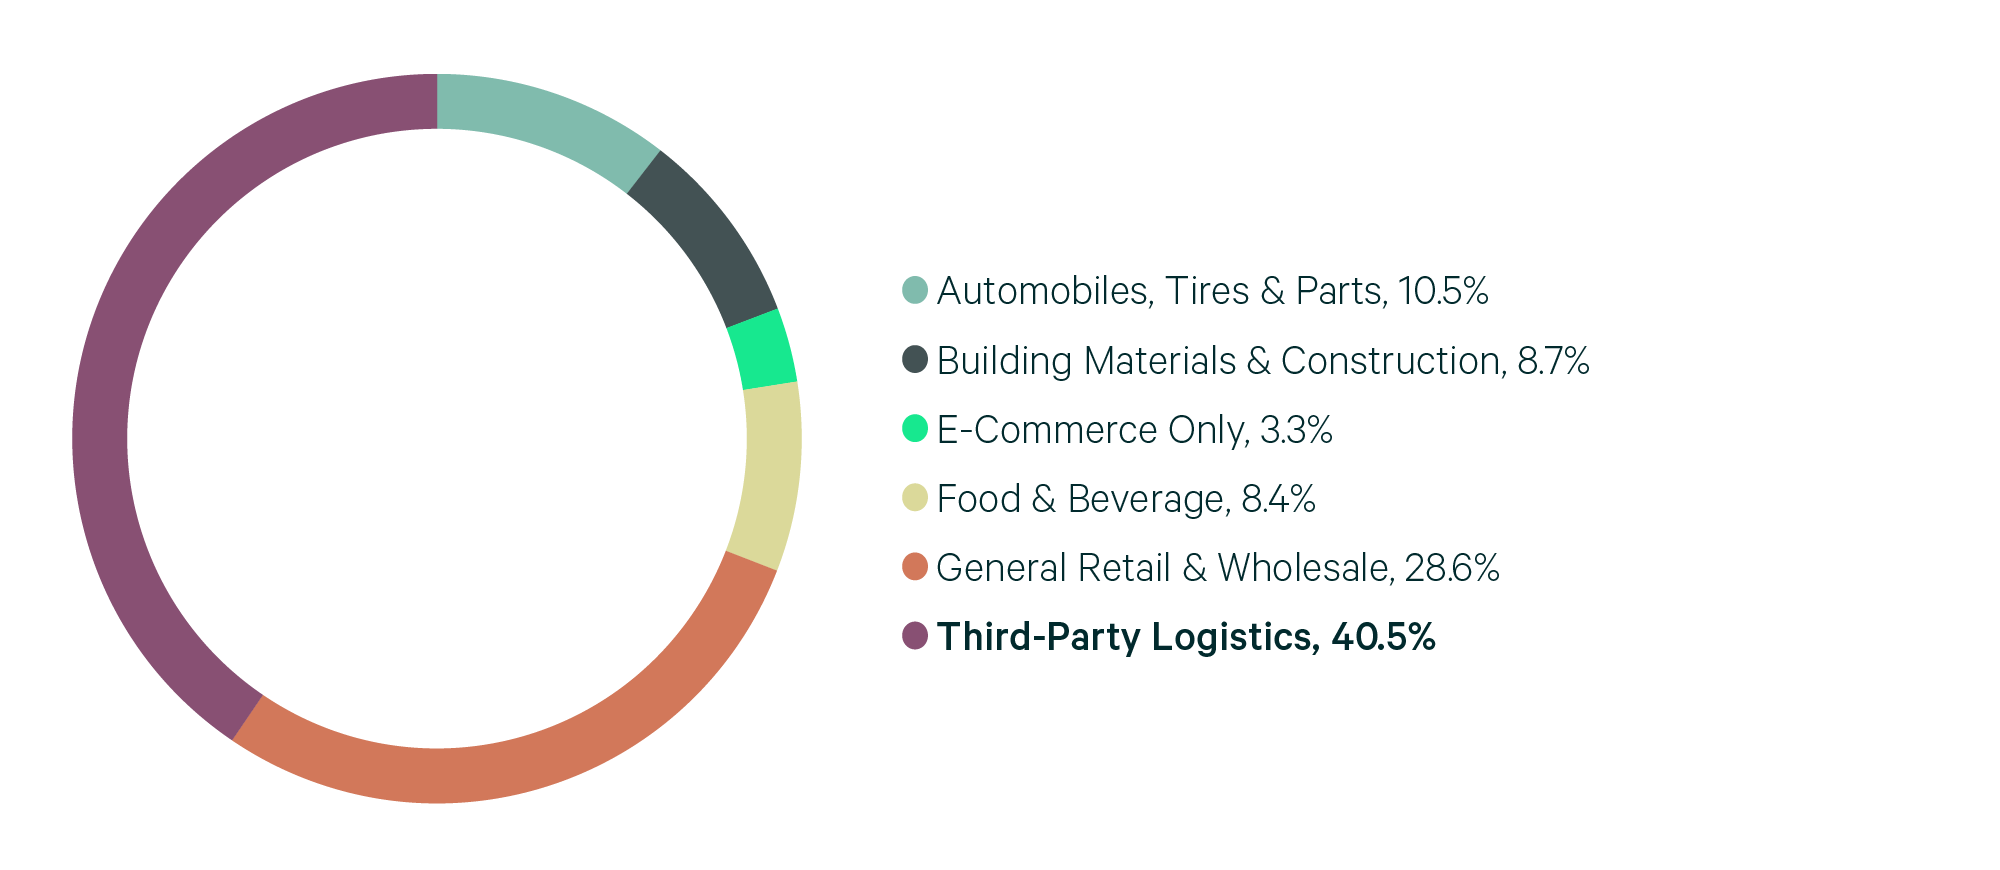
Los Angeles County, one of North America’s most established big-box markets, is dominated by buildings constructed before 2000, with 85% of the total inventory under 500,000 sq. ft. The region has North America’s second-lowest direct vacancy rate, at 1.6%. Lease renewals accounted for more than half of the market’s transaction volume of 8.1 million sq. ft., all of which were in spaces under 500,000 sq. ft. Despite land constraints, the market was able to complete 2.5 million sq. ft. of new construction, doubling last year’s total. Los Angeles County remains the most expensive big-box market in this report, with taking rents averaging $19.67 psf/yr, a year-over-year increase of just over 4%. 3PLs remained the dominant occupier, accounting for 40.5% of lease volume. They benefited from the market’s proximity to the ports of Los Angeles and Long Beach.
Los Angeles County will remain one of the tightest and most expensive big-box markets in North America due to land constraints. There is just over 4.3 million sq. ft. of space under construction. However, this is expected to have a minimal impact on the vacancy rate, which will likely remain in the low single digits. Rental rates, already at record highs, will remain steady for the foreseeable future.
Figure 4: Share of 2023 Leasing by Occupier Type
Source: CBRE Research.
Figure 5: Lease Transaction Volume by Size Range
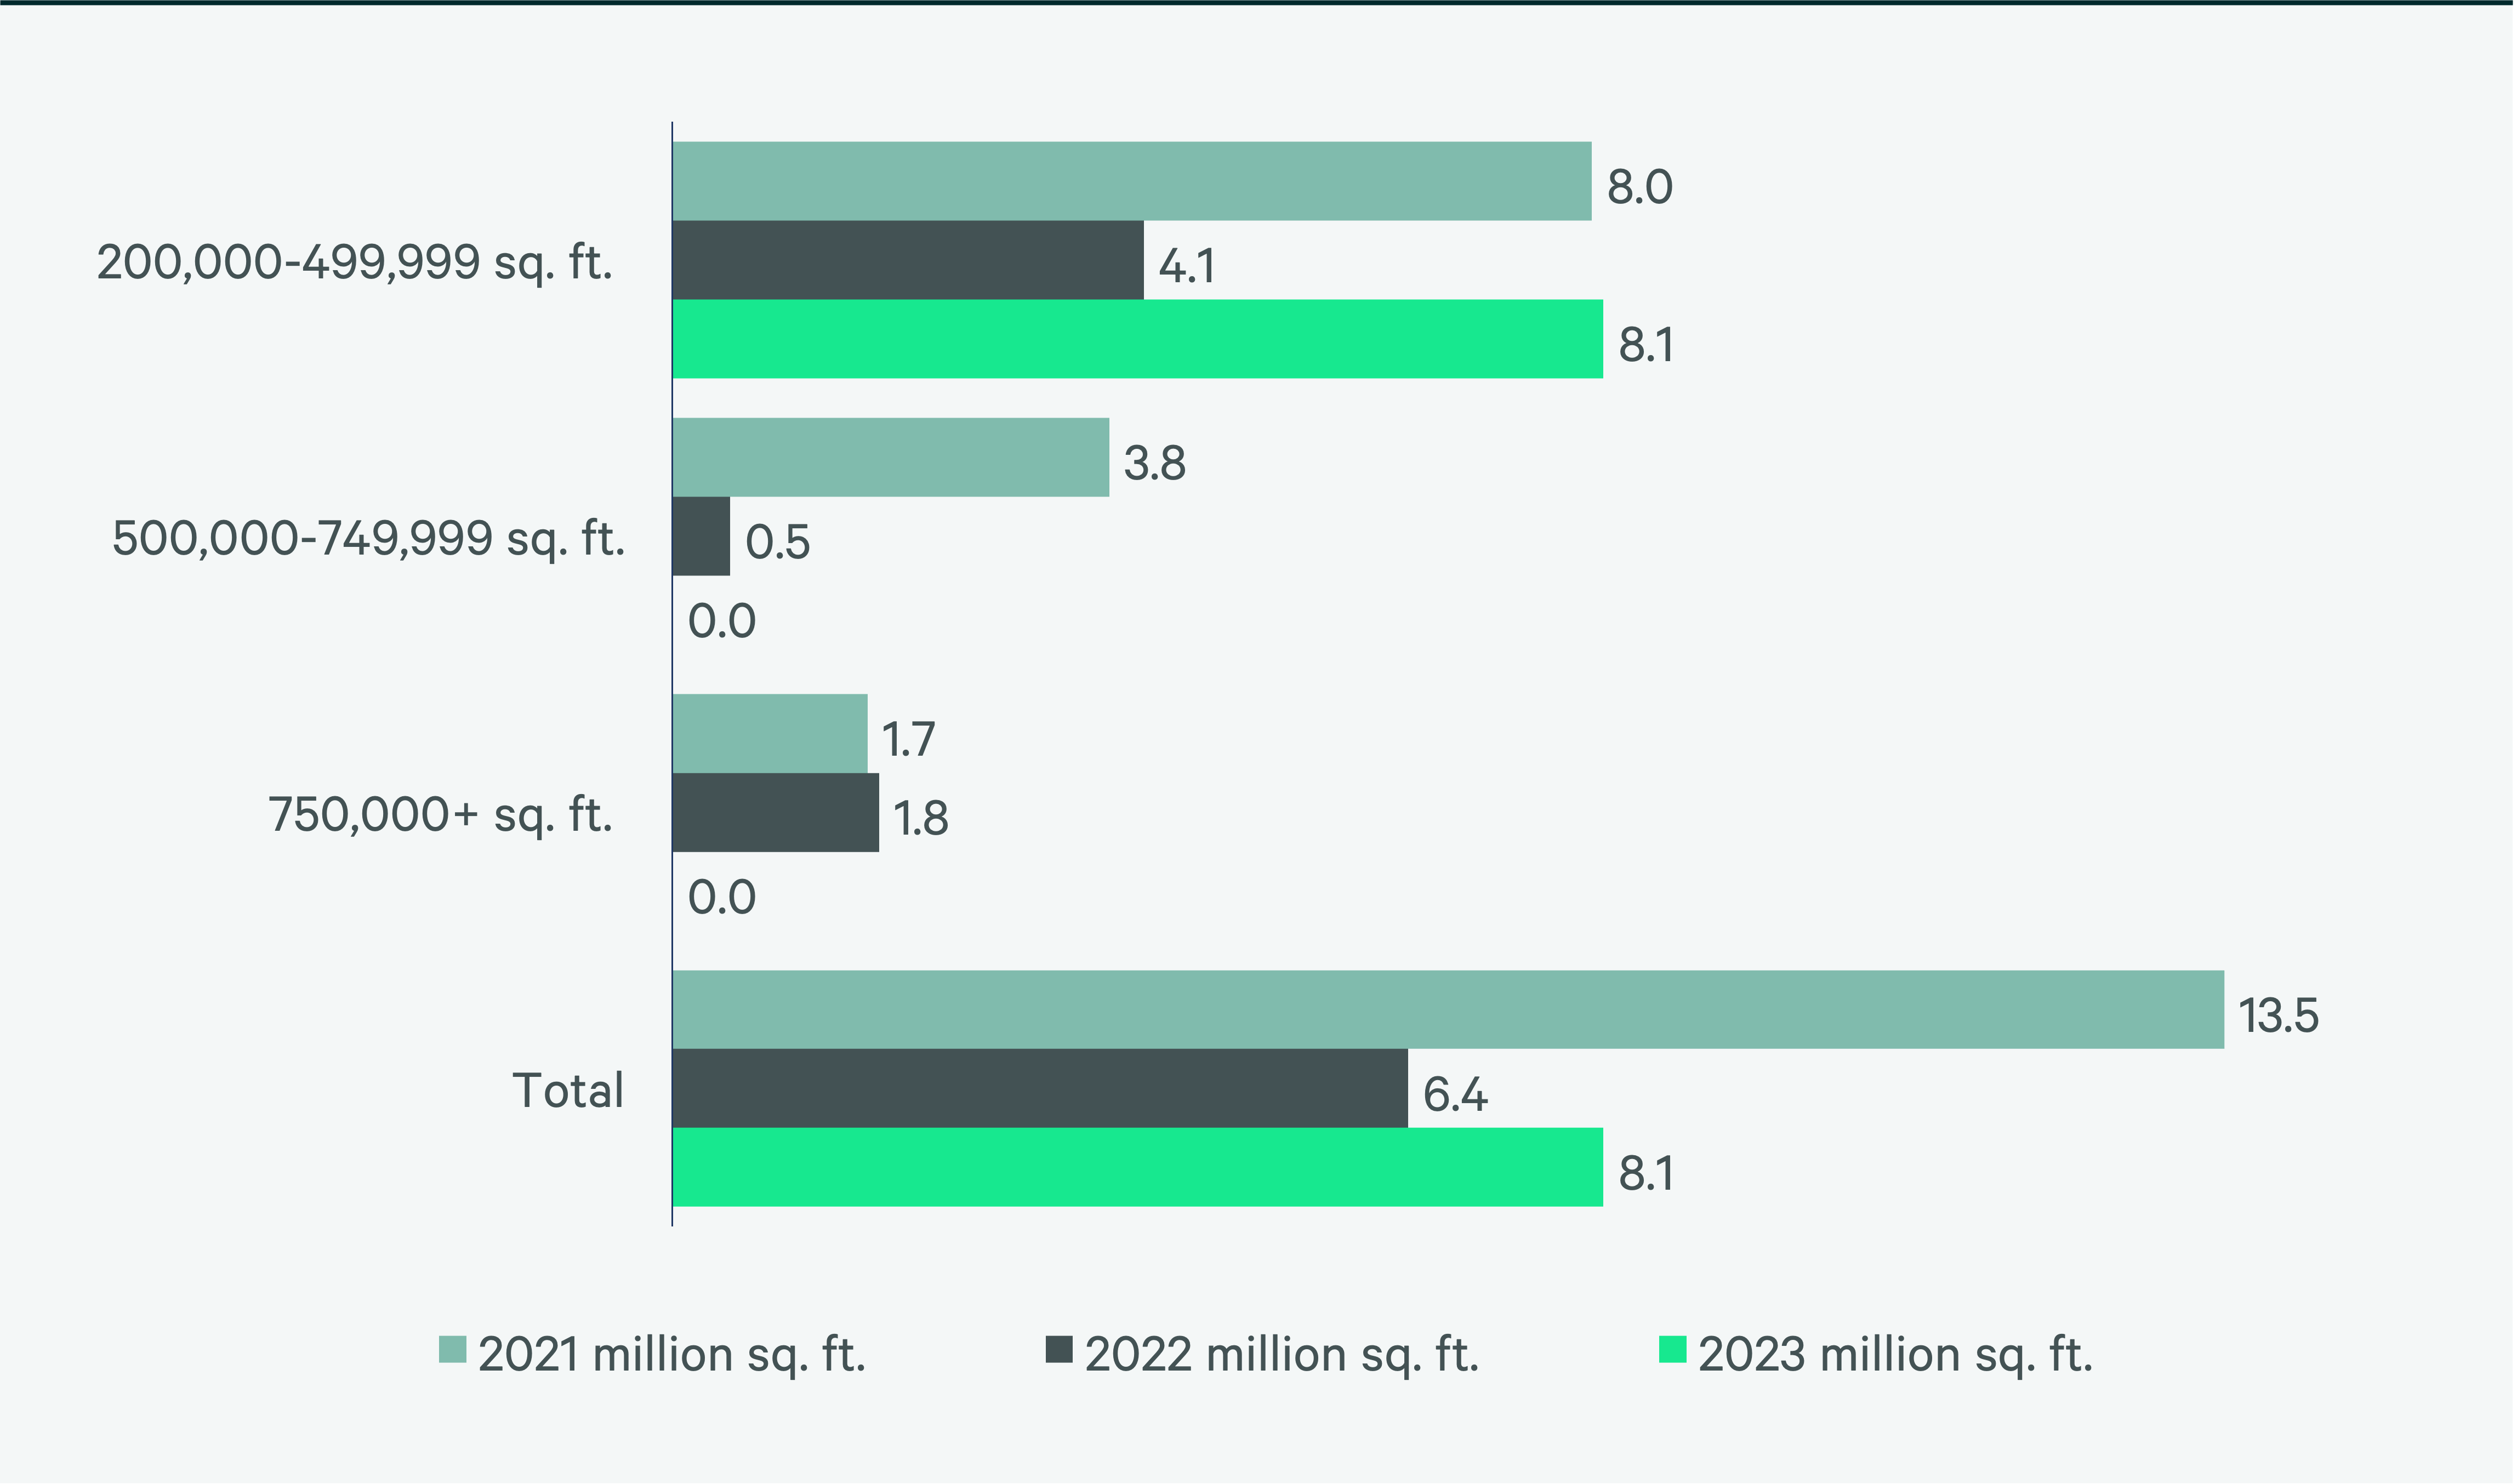
Source: CBRE Research.
Figure 6: 2023 Construction Completions vs. Overall Net Absorption by Size Range

Figure 7: Direct Vacancy Rate by Size Range
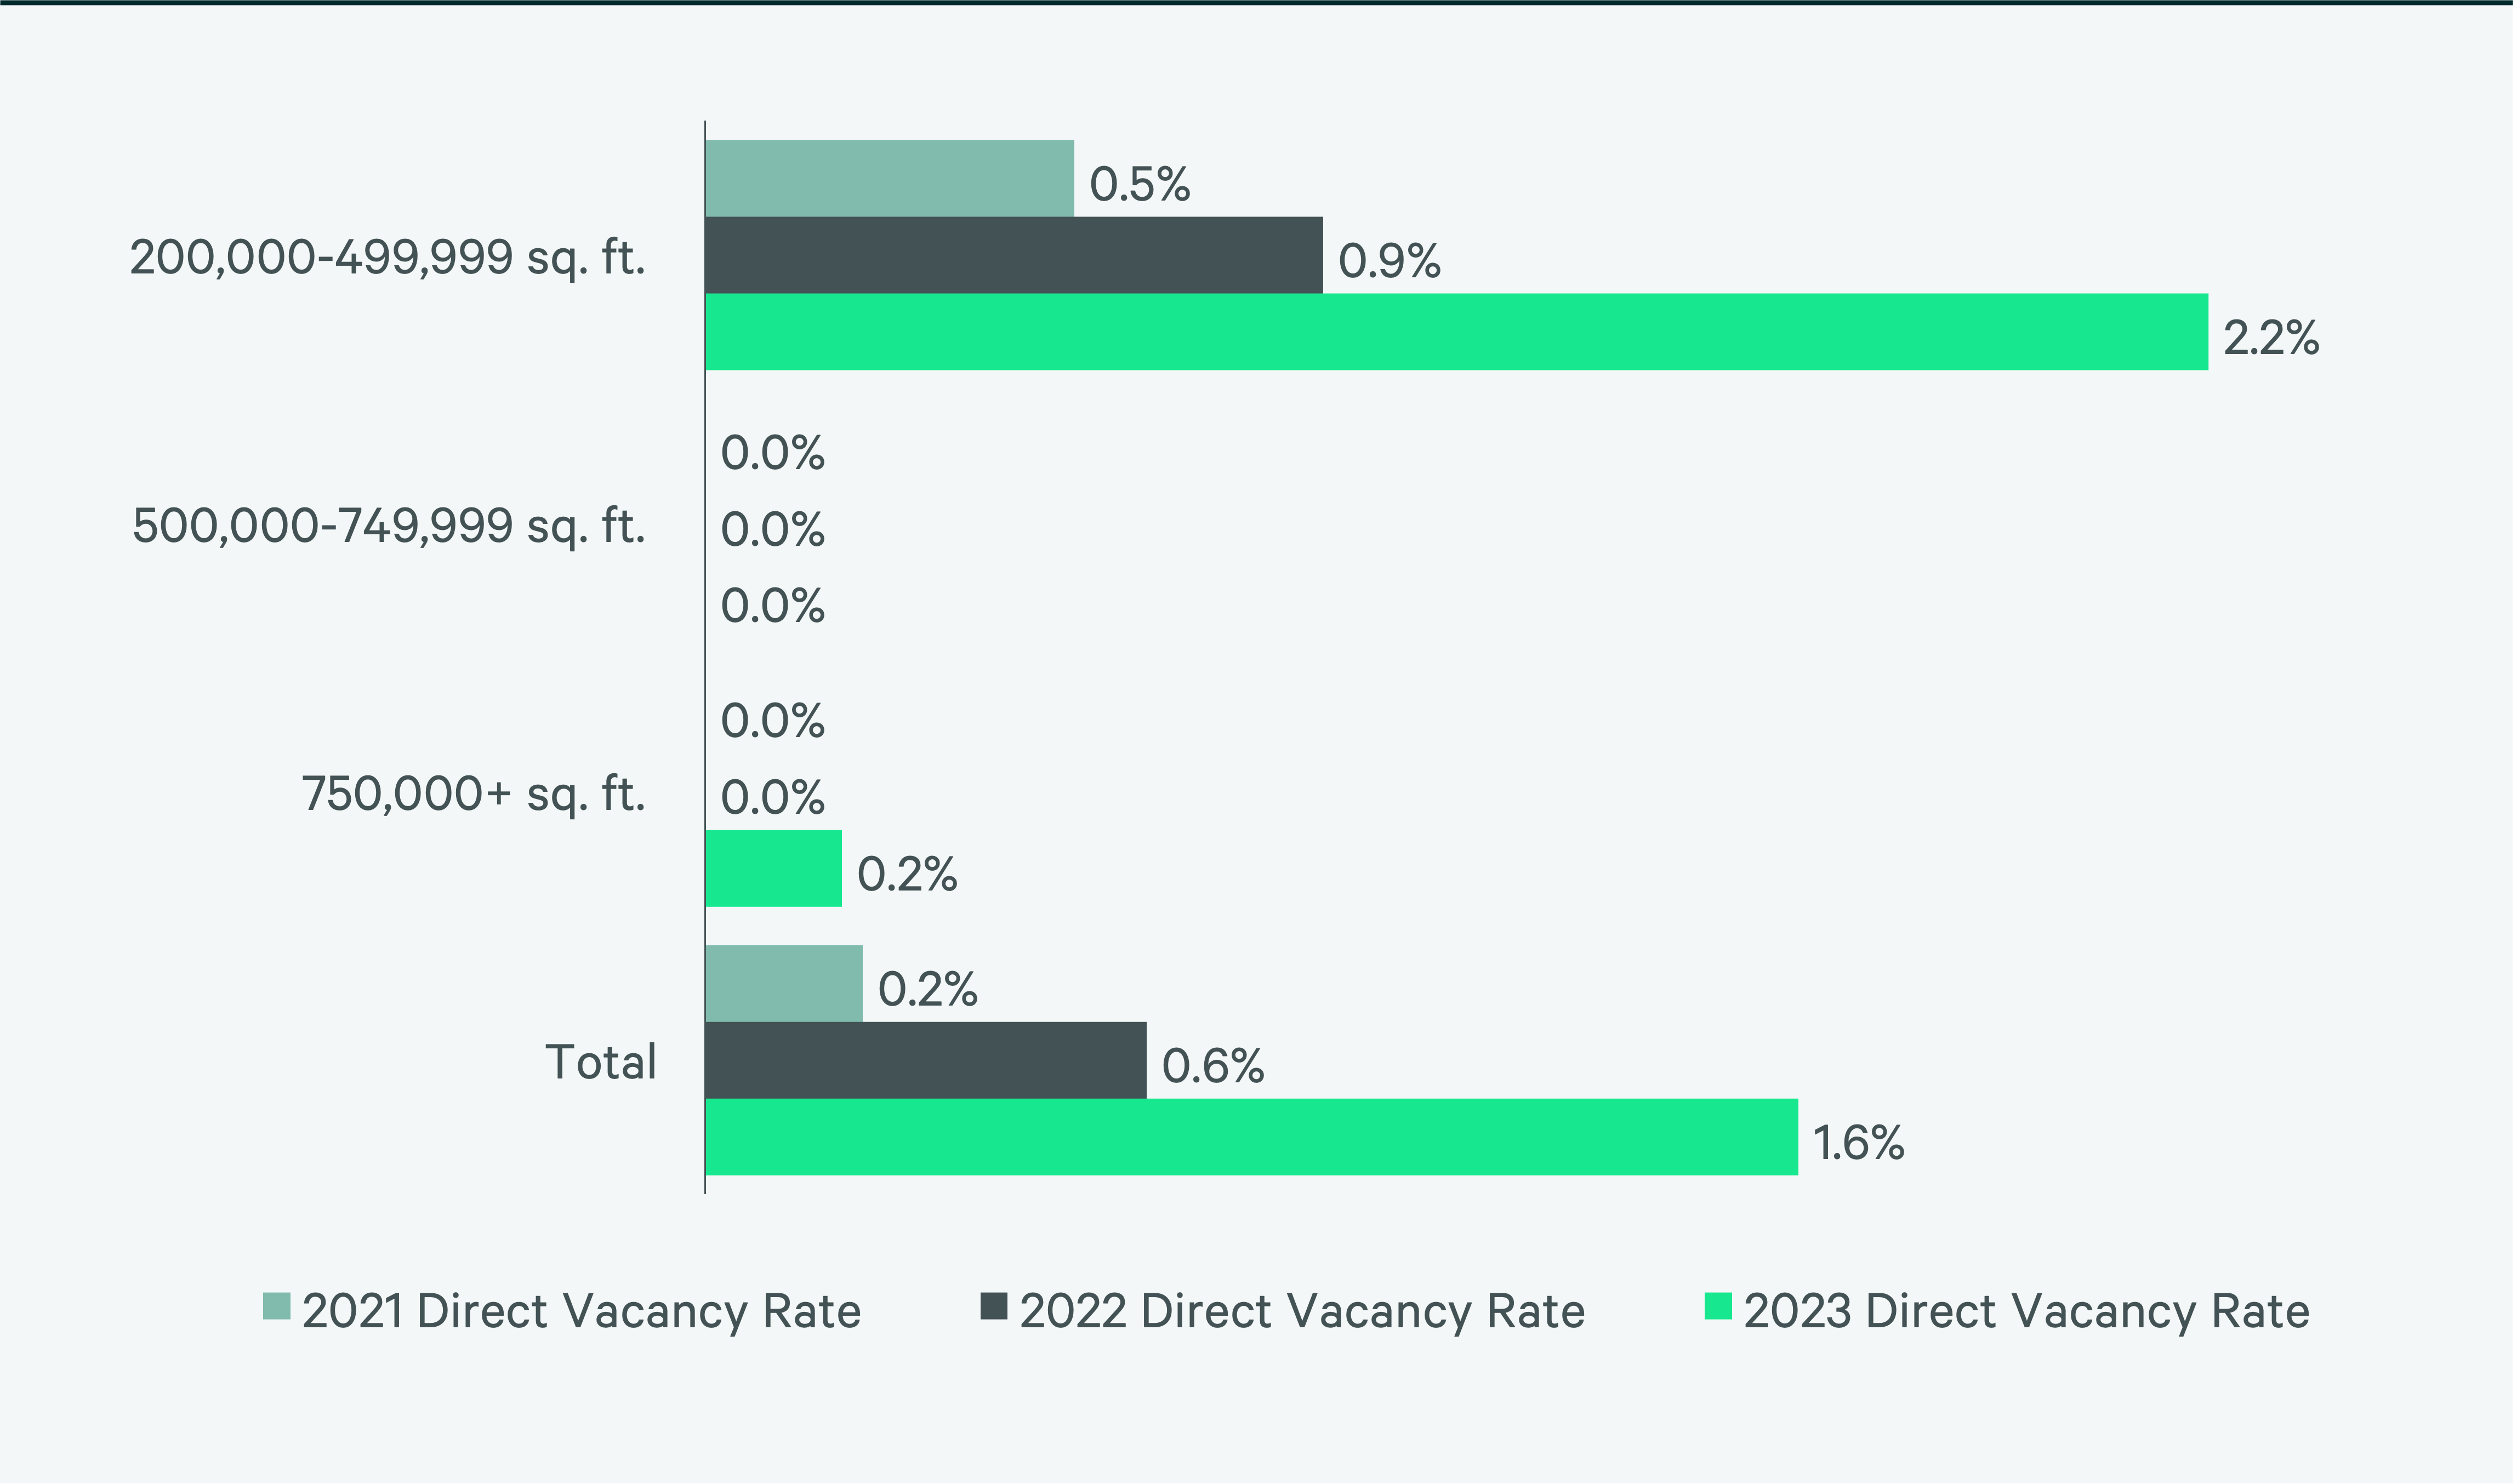
Figure 8: Under Construction & Percentage Preleased

Figure 9: First Year Taking Rents (psf/yr)
Source: CBRE Research.
Explore Big-Box Insights by Market
-

Central Valley’s proximity to the affluent Bay Area gives it convenient access to more than 5.3 million people within 50 miles of the market’s core.
-

Around 11.9 million people live within 50 miles of the market’s core, the third-most of any U.S. market in this report, with a projected 0.4% five-year growth rate.
-

Phoenix has been one of the country’s fastest-growing metros.


