Future Cities
Inland Empire
2024 North America Industrial Big-Box Review & Outlook
April 29, 2024 5 Minute Read

Demographics
Around 11.9 million people live within 50 miles of the market’s core, the third-most of any U.S. market in this report, with a projected 0.4% five-year growth rate. Twenty-six percent of the population is aged 18-34. Occupiers can reach almost 30 million consumers within 250 miles.
Figure 1: Inland Empire Population Analysis

The local warehouse labor force of 148,480 is projected to grow by 15.2% by 2034, according to CBRE Labor Analytics. The average wage for a non-supervisory warehouse worker is $20.33 per hour, 14.6% above the national average, the lowest for a major California industrial market.
Figure 2: Inland Empire Warehouse & Storage Labor Fundamentals

*Median wage (1 year experience); non-supervisory warehouse material handlers.
Location Incentives
Over the past five years, there have been over 110 economic incentives deals totaling more than $200 million for an average of $25,500 per new job in the Inland Empire, according to fDi Intelligence.
CBRE’s Location Incentives Group reports that top incentive programs offered in the IE include the California Competes Tax Credit, a discretionary income tax credit for businesses that make capital investments, create new jobs and offer strategic importance to the region. The credits are non-refundable and companies can only apply during designated application periods held three times per year. This program was extended through 2028 with $120 million in tax credits.
Figure 3: Inland Empire Top Incentive Programs
Note: The extent, if any, of state and local incentive offerings depends on location and scope of the operation.
Logistics Driver
The market is close to North America’s largest ports, in Los Angeles and Long Beach. Despite an import volume decline in 2023, the flow of imports into these ports directly feeds the region’s big-box distribution warehouses.
The market has logistics advantages from the air, ground and rail. Ontario International now ranks as a top-10 North American cargo airport by growth and volume. Ground transportation is a key to the market’s success. Interstates 10 and 15 offer direct access to the rest of the country. Also, BNSF and Union Pacific service the market with rail.

Ground transportation is a key to the market’s success.
Supply & Demand
Rents stabilized to 9.5% annual growth in 2023 after record-breaking growth in 2022. More space became available due to completed construction and tenant move-outs, increasing the overall vacancy rate from 0.1% in 2022 to 3.7% in 2023. This vacancy rate is still relatively low compared to other cities, ranking fourth lowest in this report behind Mexico City, Los Angeles County and Nashville. Construction completions were strong in 2023, totaling 26.5 million sq. ft., with the majority of it in facilities over 750,000 sq. ft. 3PLs dominated big-box leasing volume in the IE, accounting for over 58% of the activity, the highest among the markets in this report.
The IE continues to be one of the most in-demand big-box industrial markets, with leasing surpassing 30 million sq. ft. for four consecutive years. This trend is expected to continue throughout the year as occupiers aim to strengthen their storage and distribution capabilities. Despite continued demand, vacancy rates should remain steady. This is because occupiers are consolidating their operations out of older big-box spaces in the market, and most of the 14 million sq. ft. currently under construction will become available. Although rental rate growth is expected to be minimal, the IE will to continue to command some of the highest rents in North America for the foreseeable future.
Figure 4: Share of 2023 Leasing by Occupier Type

Source: CBRE Research.
Figure 5: Lease Transaction Volume by Size Range
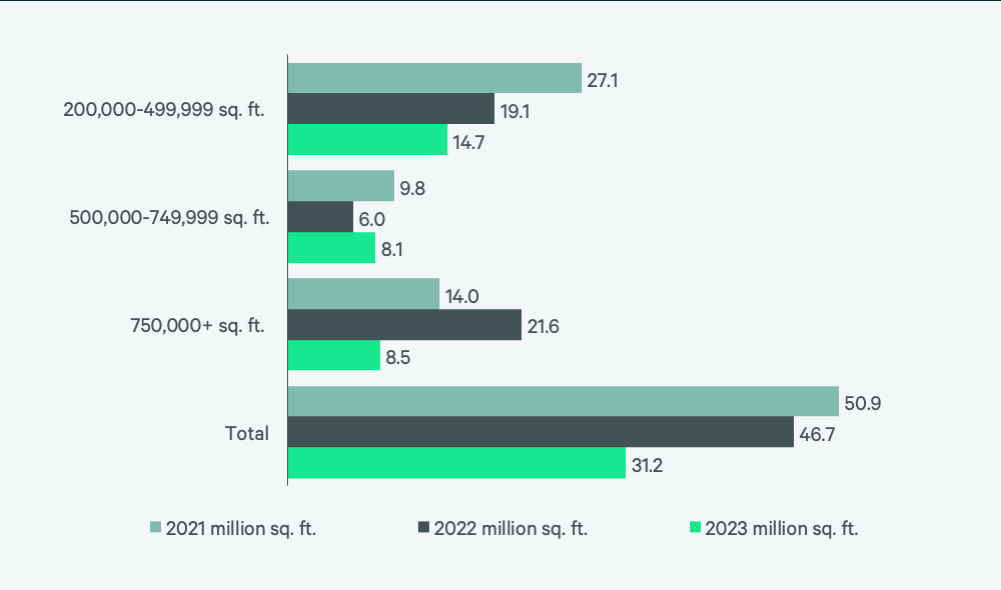
Source: CBRE Research.
Figure 6: 2023 Construction Completions vs. Overall Net Absorption by Size Range
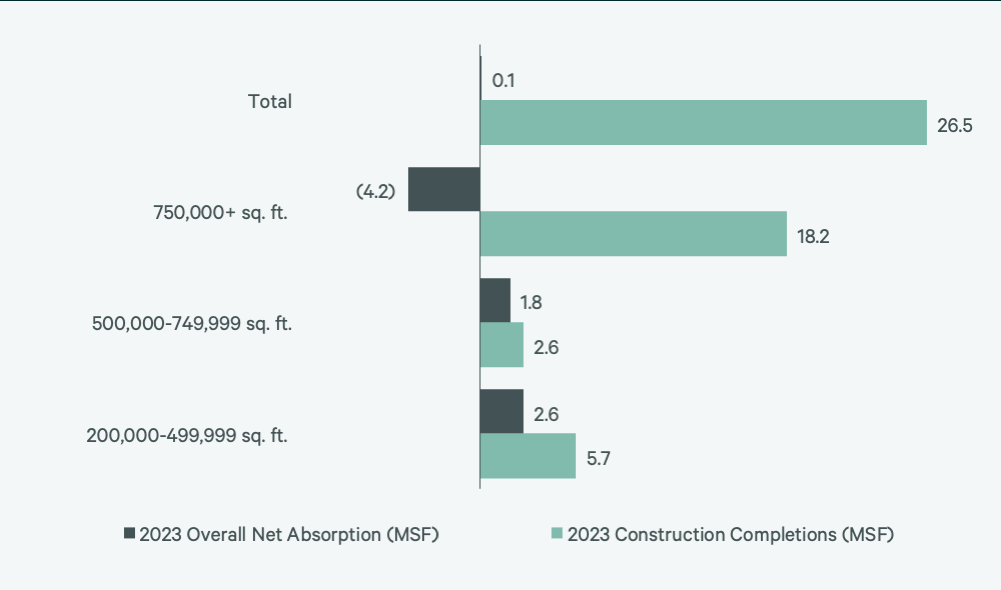
Figure 7: Direct Vacancy Rate by Size Range

Figure 8: Under Construction & Percentage Preleased
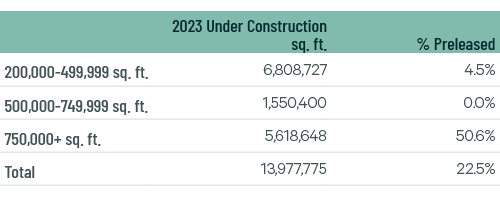
Figure 9: First Year Taking Rents (psf/yr)
Source: CBRE Research.
Explore Big-Box Insights by Market
-

Central Valley’s proximity to the affluent Bay Area gives it convenient access to more than 5.3 million people within 50 miles of the market’s core.
-

Over 15 million people live within 50 miles of the market’s core—the second-largest population of any U.S. market in this report, with a flat expected five-year growth rate.
-

Phoenix has been one of the country’s fastest-growing metros.


