Chapter 4
Australian Market Comparisons
CBRE New Zealand Real Estate Market Outlook 2026
10 Minute Read
10 Minute Read
Looking for a PDF of this content?
Australian Market Comparisons
Australian commercial property markets provide a useful benchmark for New Zealand, with cap rate movements, rental growth and incentive trends across industrial, office and retail sectors highlighting where the two markets align or diverge. These comparisons help indicate how pricing, demand and cyclical conditions may evolve in New Zealand through 2026 and 2027.

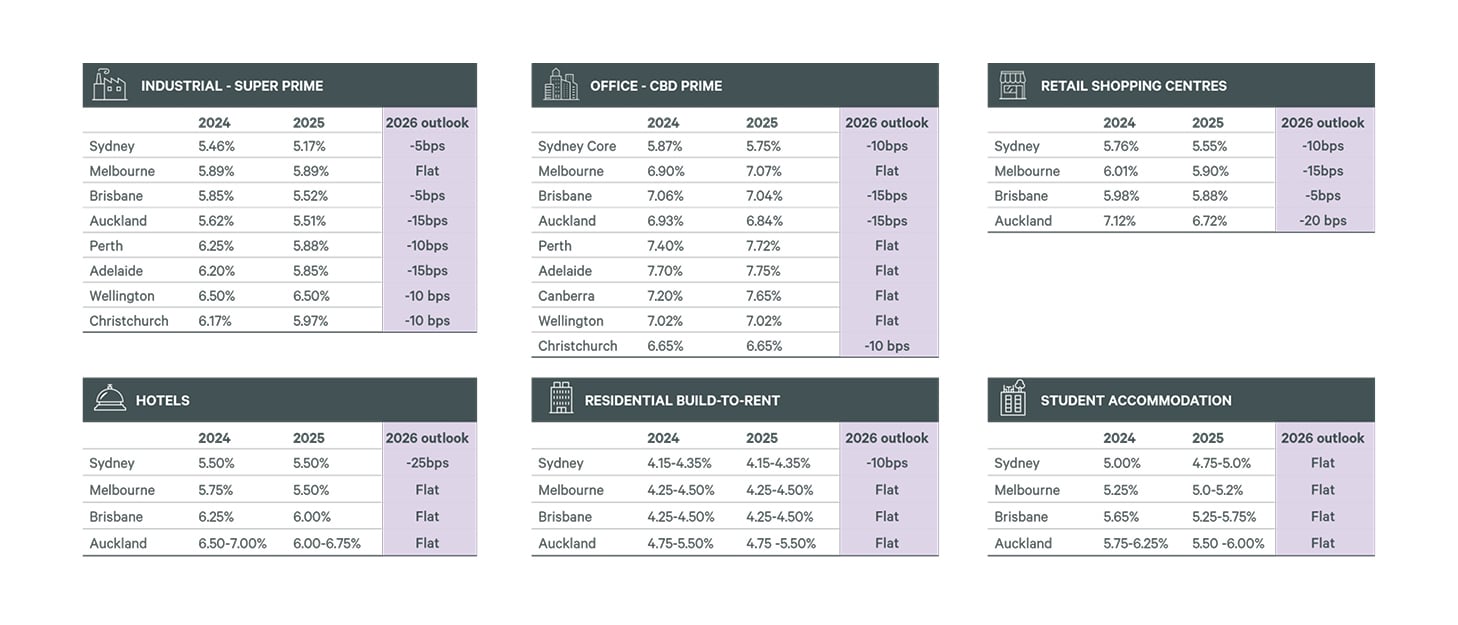
Indicative cap rates for Prime assets in select locations
Australia & New Zealand Industrial Market Comparisons
Momentum is expected to strengthen further in 2027, as incentive levels unwind more meaningfully across most markets, supporting a stronger effective rent growth.
We expect that the New Zealand industrial markets will follow a similar pattern with the current weaker conditions gradually strengthening through late 2026, into 2027.

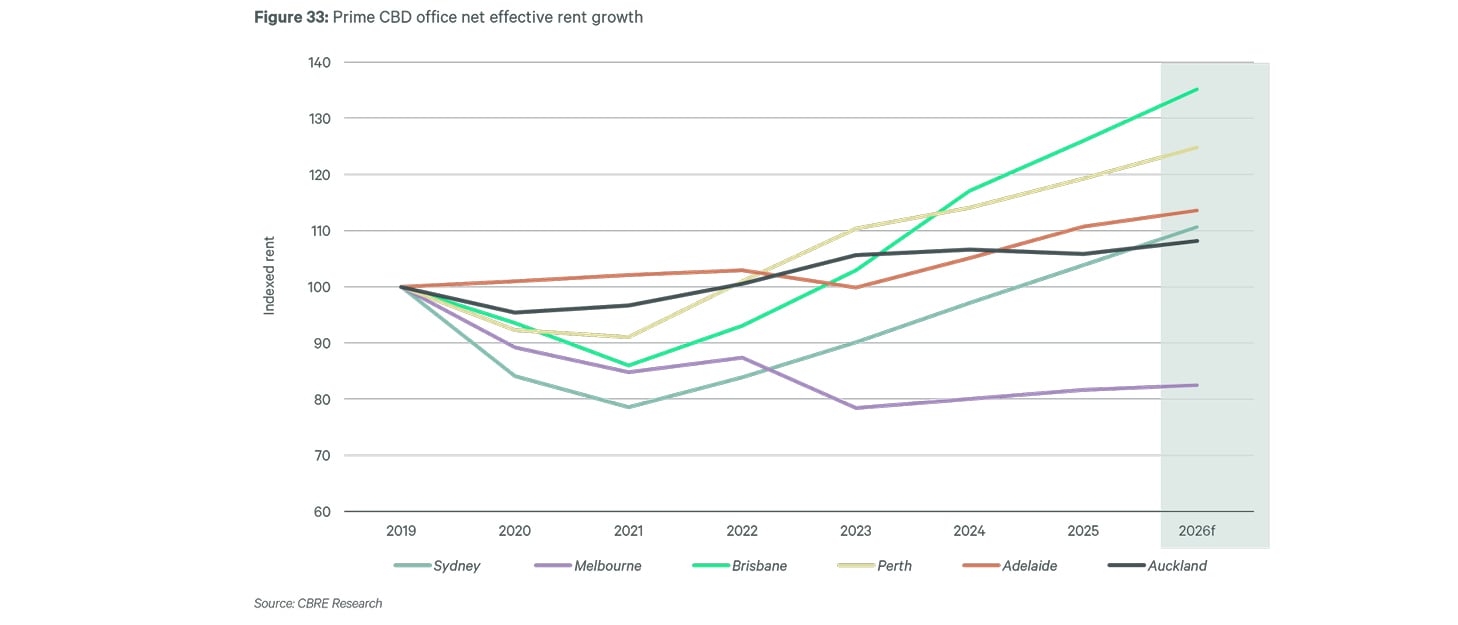
Australia & New Zealand Office Market Comparisons
The highest growth rates are expected in Brisbane CBD +7.3% and Sydney CBD +6.6%. For Melbourne, we’re baking in a recovery from 2027 onwards as the market starts to tighten following recent supply impacts. For Adelaide, Canberra and Perth CBD, we forecast low to mid-single digit NER in 2026.
The large gap in rents between existing buildings and new development is helping to push up rents in stronger performing markets. Also, the major contractionary activity and sublease availability of the past few years appears to have passed. Finally, markets that have been relatively weak, like Melbourne, are witnessing centralisation into the CBD. This will underpin net absorption and help to drive rents higher.
Auckland face rents remained largely stable, but incentives increased in 2025, driving net effective rents to fall. As space market conditions improve, incentives could be withdrawn quite rapidly which will result in effective rents bouncing back more strongly in 2027 to 2028.
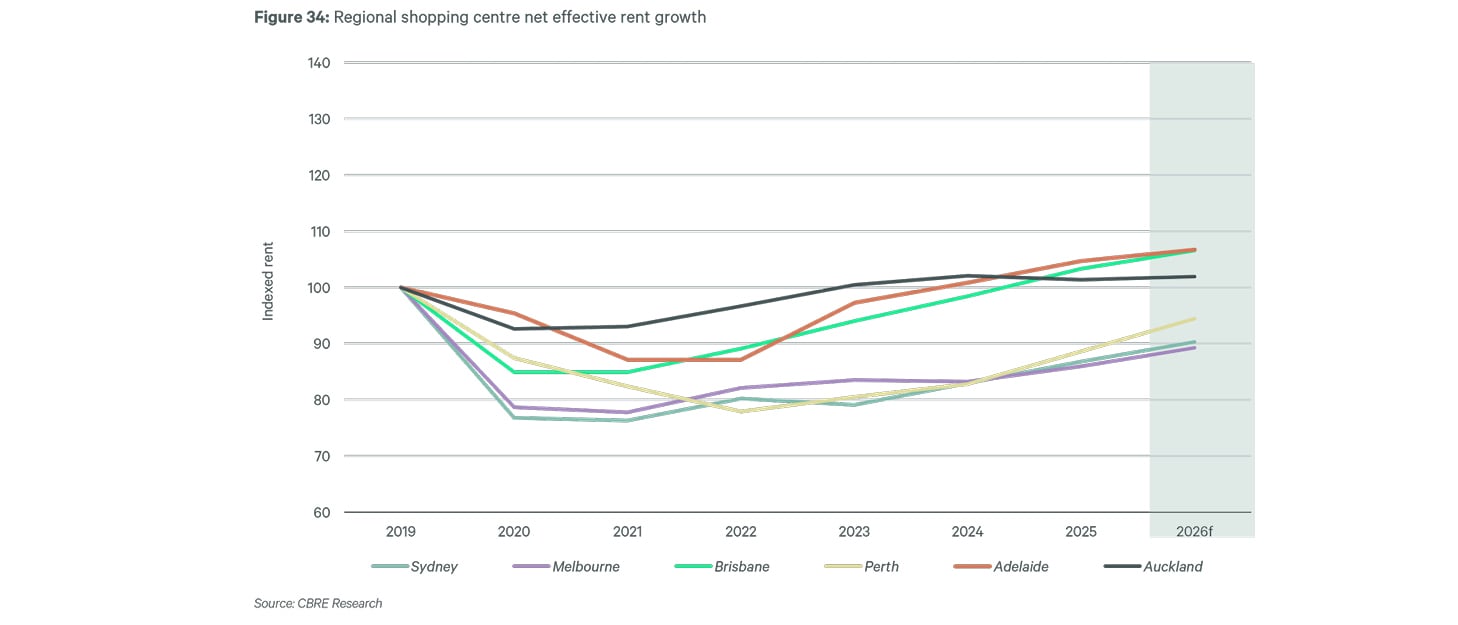
Australia & New Zealand Retail Market Comparisons
Shopping centre occupancy has remained resilient, in the high 90% range. Limited supply of new space and solid occupancy levels will help to maintain demand for shopping centre space.
CBD rents are expected to continue their post-COVID recovery, growing by low-single digits across 2026. Melbourne will see the strongest turnaround after the completion of a number of key retail developments in and around Bourke Street Mall expected to spur a recovery in tenant demand.
In Auckland, the slowing momentum of rent growth seen in the first half of 2025 has continued into the second half. Despite recent retail sales growth surprising on the upside, we only anticipate a weak rental rebound in 2026, with growth strengthening in 2027 to 2029.
Related Insights
-
Report | Intelligent Investment
Pacific Real Estate Market Outlook - April 2026 edition
January 27, 2026

CBRE’s 2026 Pacific Market Outlook highlights key trends and overarching themes that will guide market shifts and decision making.
-

CBRE’s 2026 Asia Pacific Investor Intentions Survey uncovered a further improvement in buying intentions across most markets in Asia Pacific this year
-
The latest New Zealand Property Occupancy Costs and Rental Affordability report examines occupancy cost ratios and their implications for investors and occupiers. Read now.
-

Discover key insights into hybrid working, workplace trends, and real estate strategies shaping New Zealand’s office market in 2025. Explore data-driven guidance for occupiers and landlords on office attendance, space utilisation, and sustainable workplace solutions.
-

Discover how the gap between the sustainability goals of major occupiers and the environmental performance of the buildings they occupy presents a significant opportunity for landlords and developers.
-
In Q3, market yields experienced notable firming, the most significant since Q2 2021, as lower interest rates enhanced liquidity and pricing for assets.