Future Cities
Puget Sound
2024 North America Industrial Big-Box Review & Outlook
April 29, 2024 5 Minute Read

Demographics
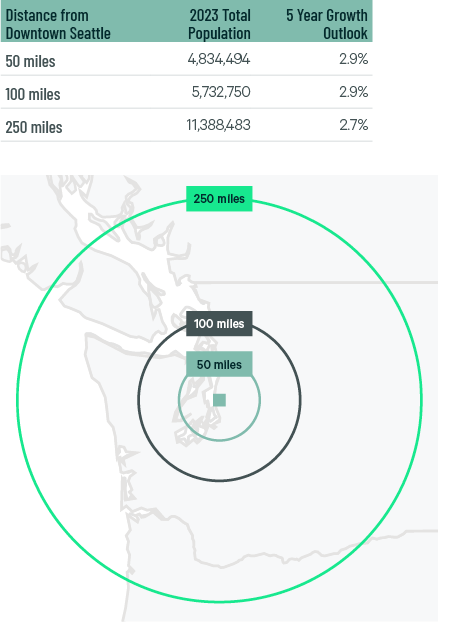
More than 4.8 million people live within 50 miles of the market’s core, with a projected 2.9% five-year growth rate—the highest of any major West Coast market. More than 11 million people or 4.3 million households are within 250 miles, with a 2.7% projected five-year growth rate.
Figure 1: Puget Sound Population Analysis
The local warehouse labor force of 62,644 is expected to grow by 8.7% by 2034, according to CBRE Labor Analytics. The average wage for a non-supervisory warehouse worker is $22.99 per hour, 29.6% above the national average and the highest of any market in this report.
Figure 2: Puget Sound Warehouse & Storage Labor Fundamentals

* Median wage (1 year experience); non-supervisory warehouse material handlers
Location Incentives
Over the past five years, there have been over 30 economic incentives deals totaling more than $50 million for an average of $17,100 per new job in the Seattle metropolitan area, according to fDi Intelligence.
CBRE’s Location Incentives Group reports that top incentive programs offered in metro Seattle include a sales and use tax exemption for machinery and equipment used directly in manufacturing, warehouse or research and development operations. Service charges for installing, repairing, improving or cleaning the machinery and equipment are also sales tax-exempt.
Figure 3: Puget Sound Top Incentive Programs
Note: The extent, if any, of state and local incentive offerings depends on location and scope of the operation.
Logistics Driver
The Northwest Seaport Alliance, which includes the ports of Seattle and Tacoma, is the U.S.’s fifth-largest container gateway. The ports are less congested than their California counterparts and provide a shorter direct route to Asia. Union Pacific and BNSF rail lines link the ports to the Midwest. Seattle-Tacoma International Airport hosts 24 air carriers and I-5 passes through the region, providing direct access to the entire West Coast.

The Northwest Seaport Alliance is the U.S.’s fifth-largest container gateway. The ports are less congested than their California counterparts and provide a shorter direct route to Asia.
Supply & Demand
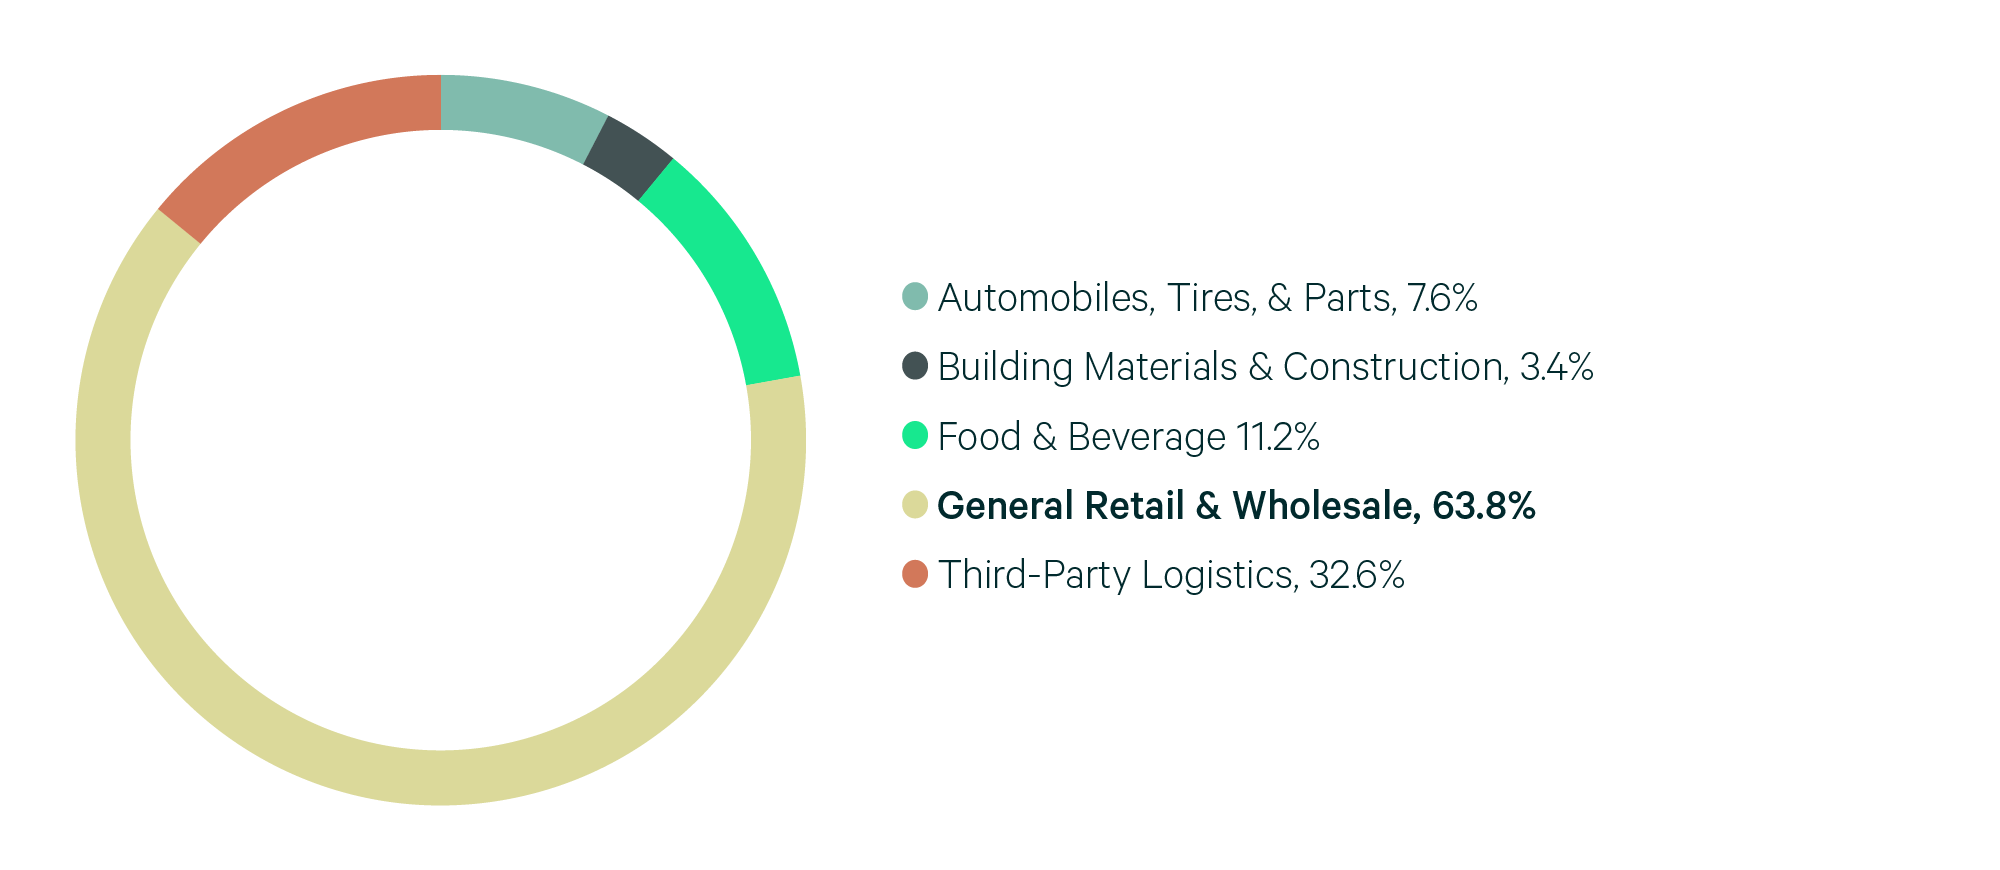
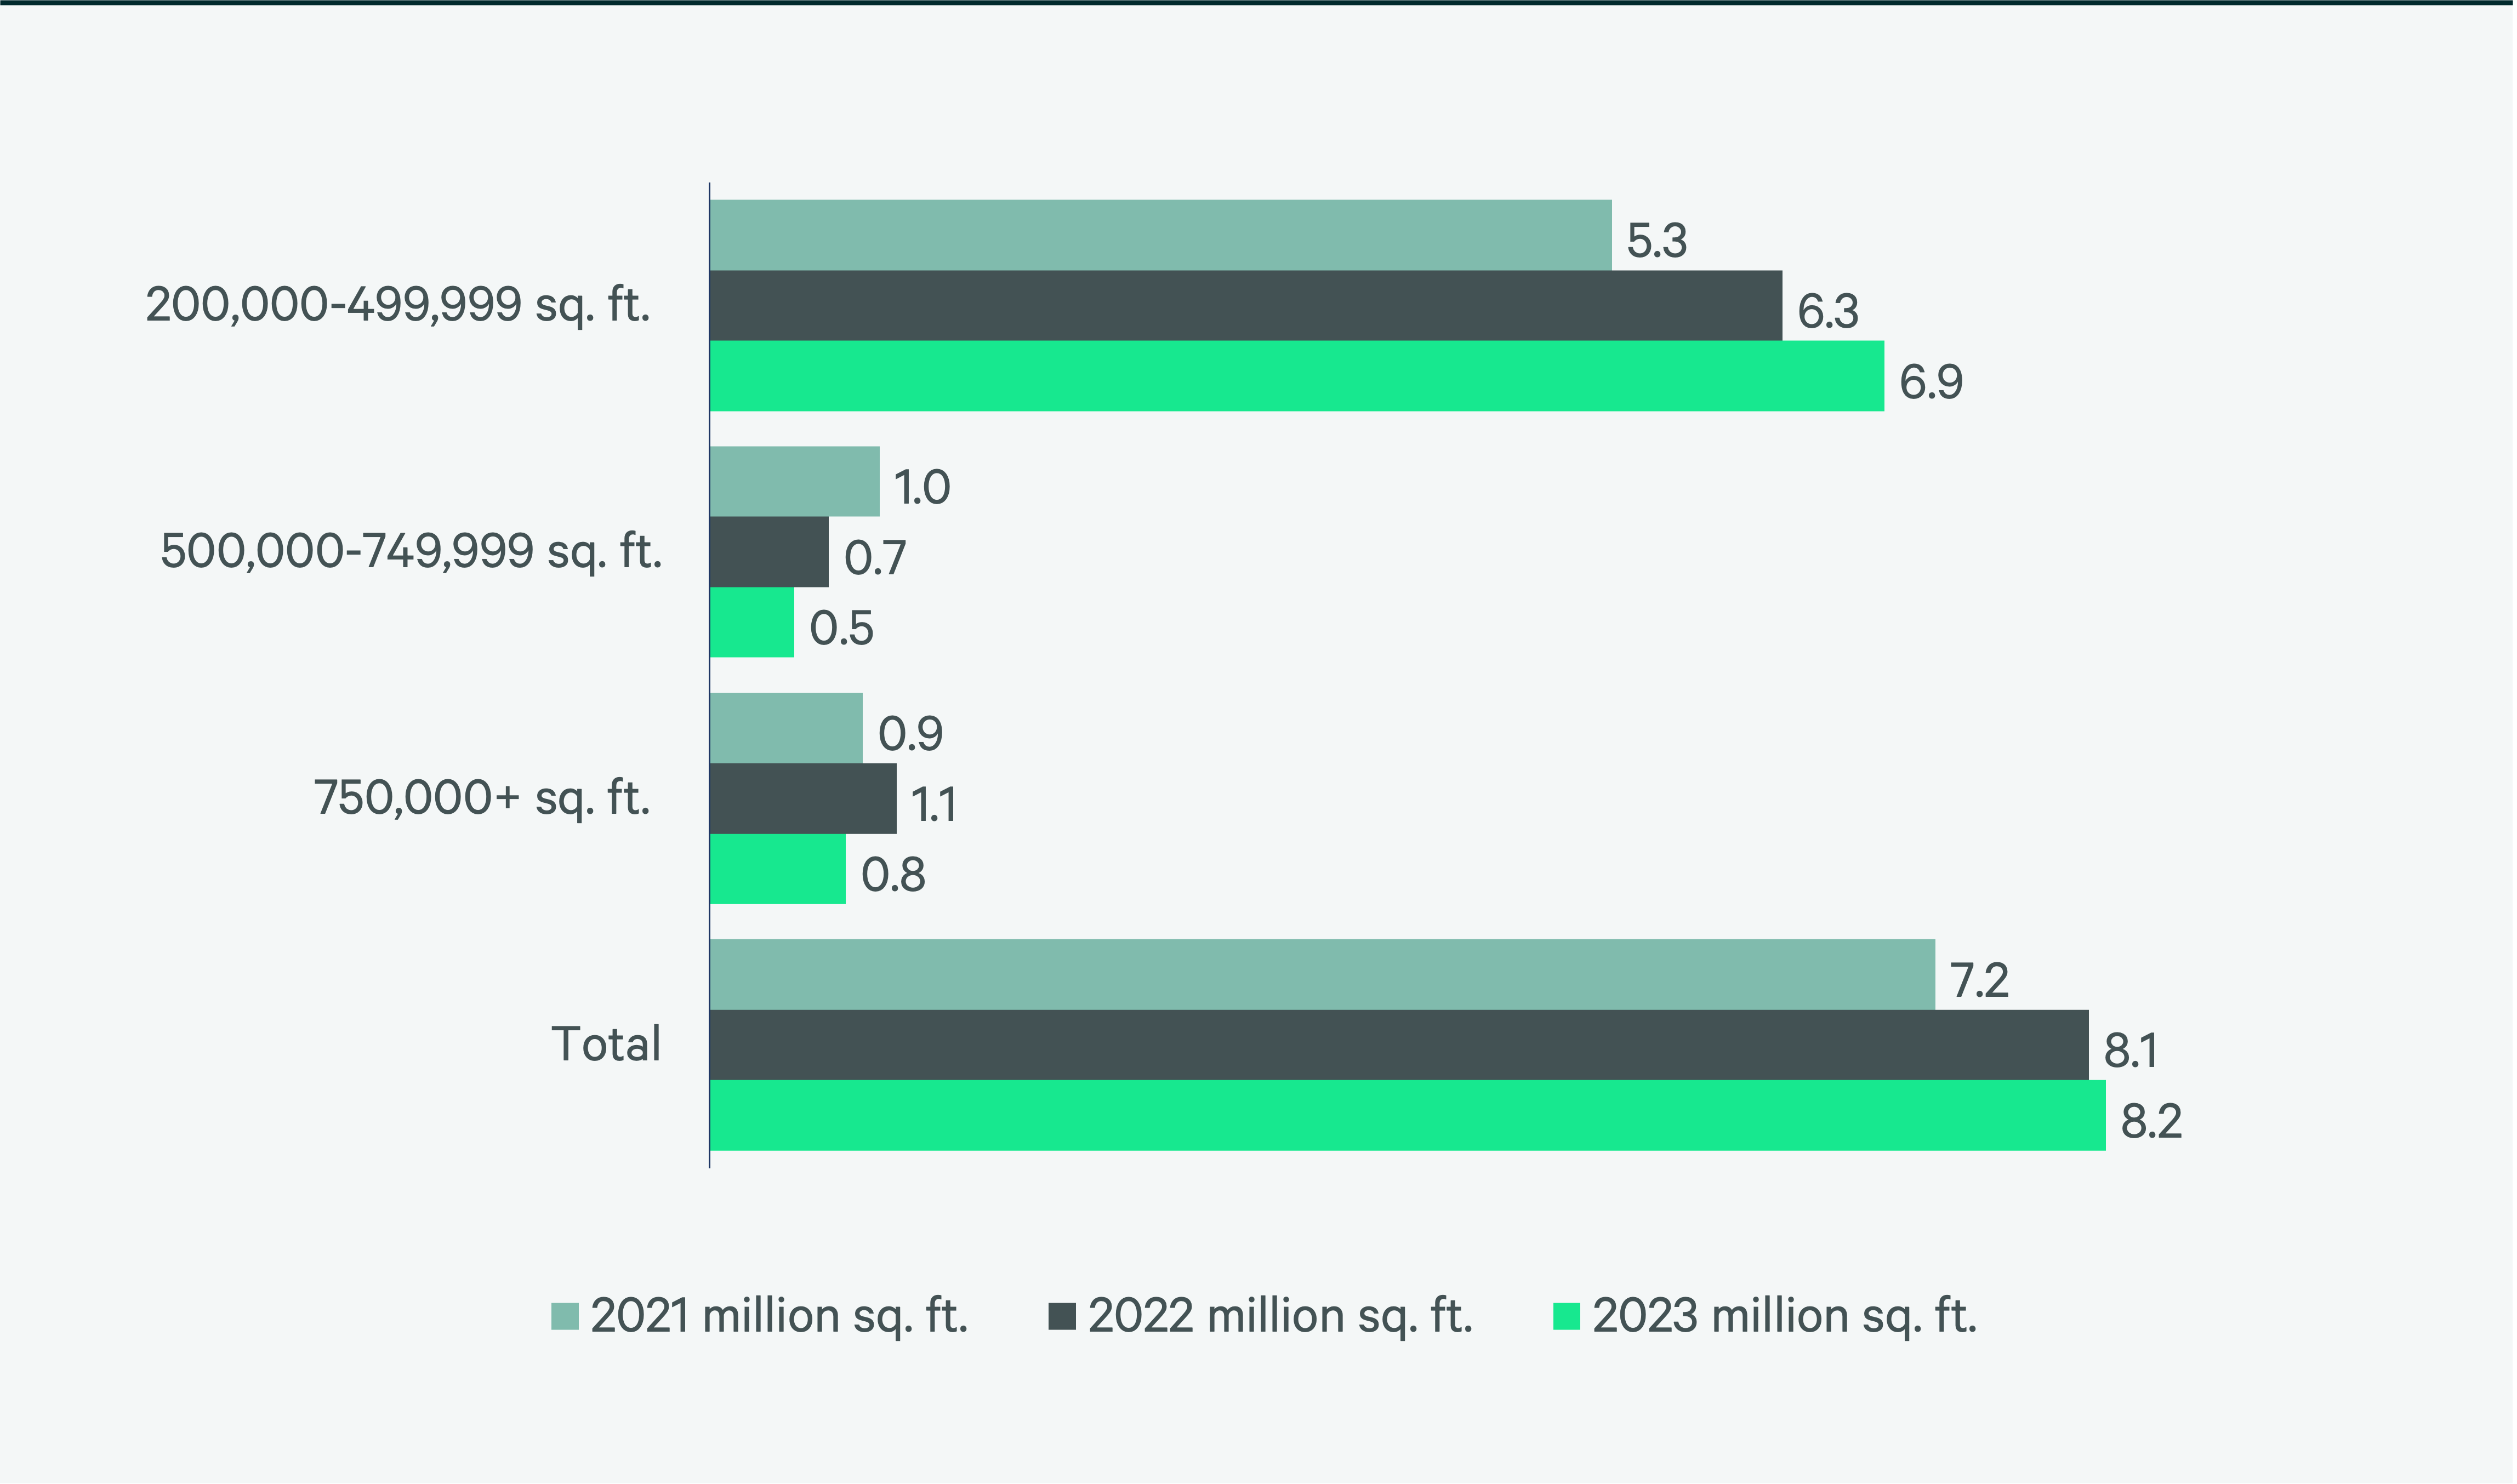
Puget Sound was one of the few big-box markets to post year-over-year growth in lease transaction, reaching 8.2 million sq. ft. leased, an increase of 100,000 sq. ft. from 2022. Despite slightly increased leasing, net absorption decreased to 1 million sq. ft. This reduction, coupled with 4 million sq. ft. of construction completions, drove the overall vacancy rate up to 5.7%. Most of this vacancy rate increase occurred in buildings smaller than 500,000 sq. ft., which ended 2023 with a vacancy rate of 7.8%, significantly higher than 2022’s 4.4% rate. General retailers & wholesalers were the top occupier in 2023, accounting for 63.8% of total lease volume.
6.7 million sq. ft. was under construction at year-end, with nearly half of it preleased. The over 3 million sq. ft. of space under construction delivering this year will likely prevent significantly lowered vacancy. However, the market will likely not experience a strongly rising vacancy rate in the coming quarters either.
Figure 4: Share of 2023 Leasing by Occupier Type
Source: CBRE Research.
Figure 5: Lease Transaction Volume by Size Range
Source: CBRE Research.
Figure 6: 2023 Construction Completions vs. Overall Net Absorption by Size Range
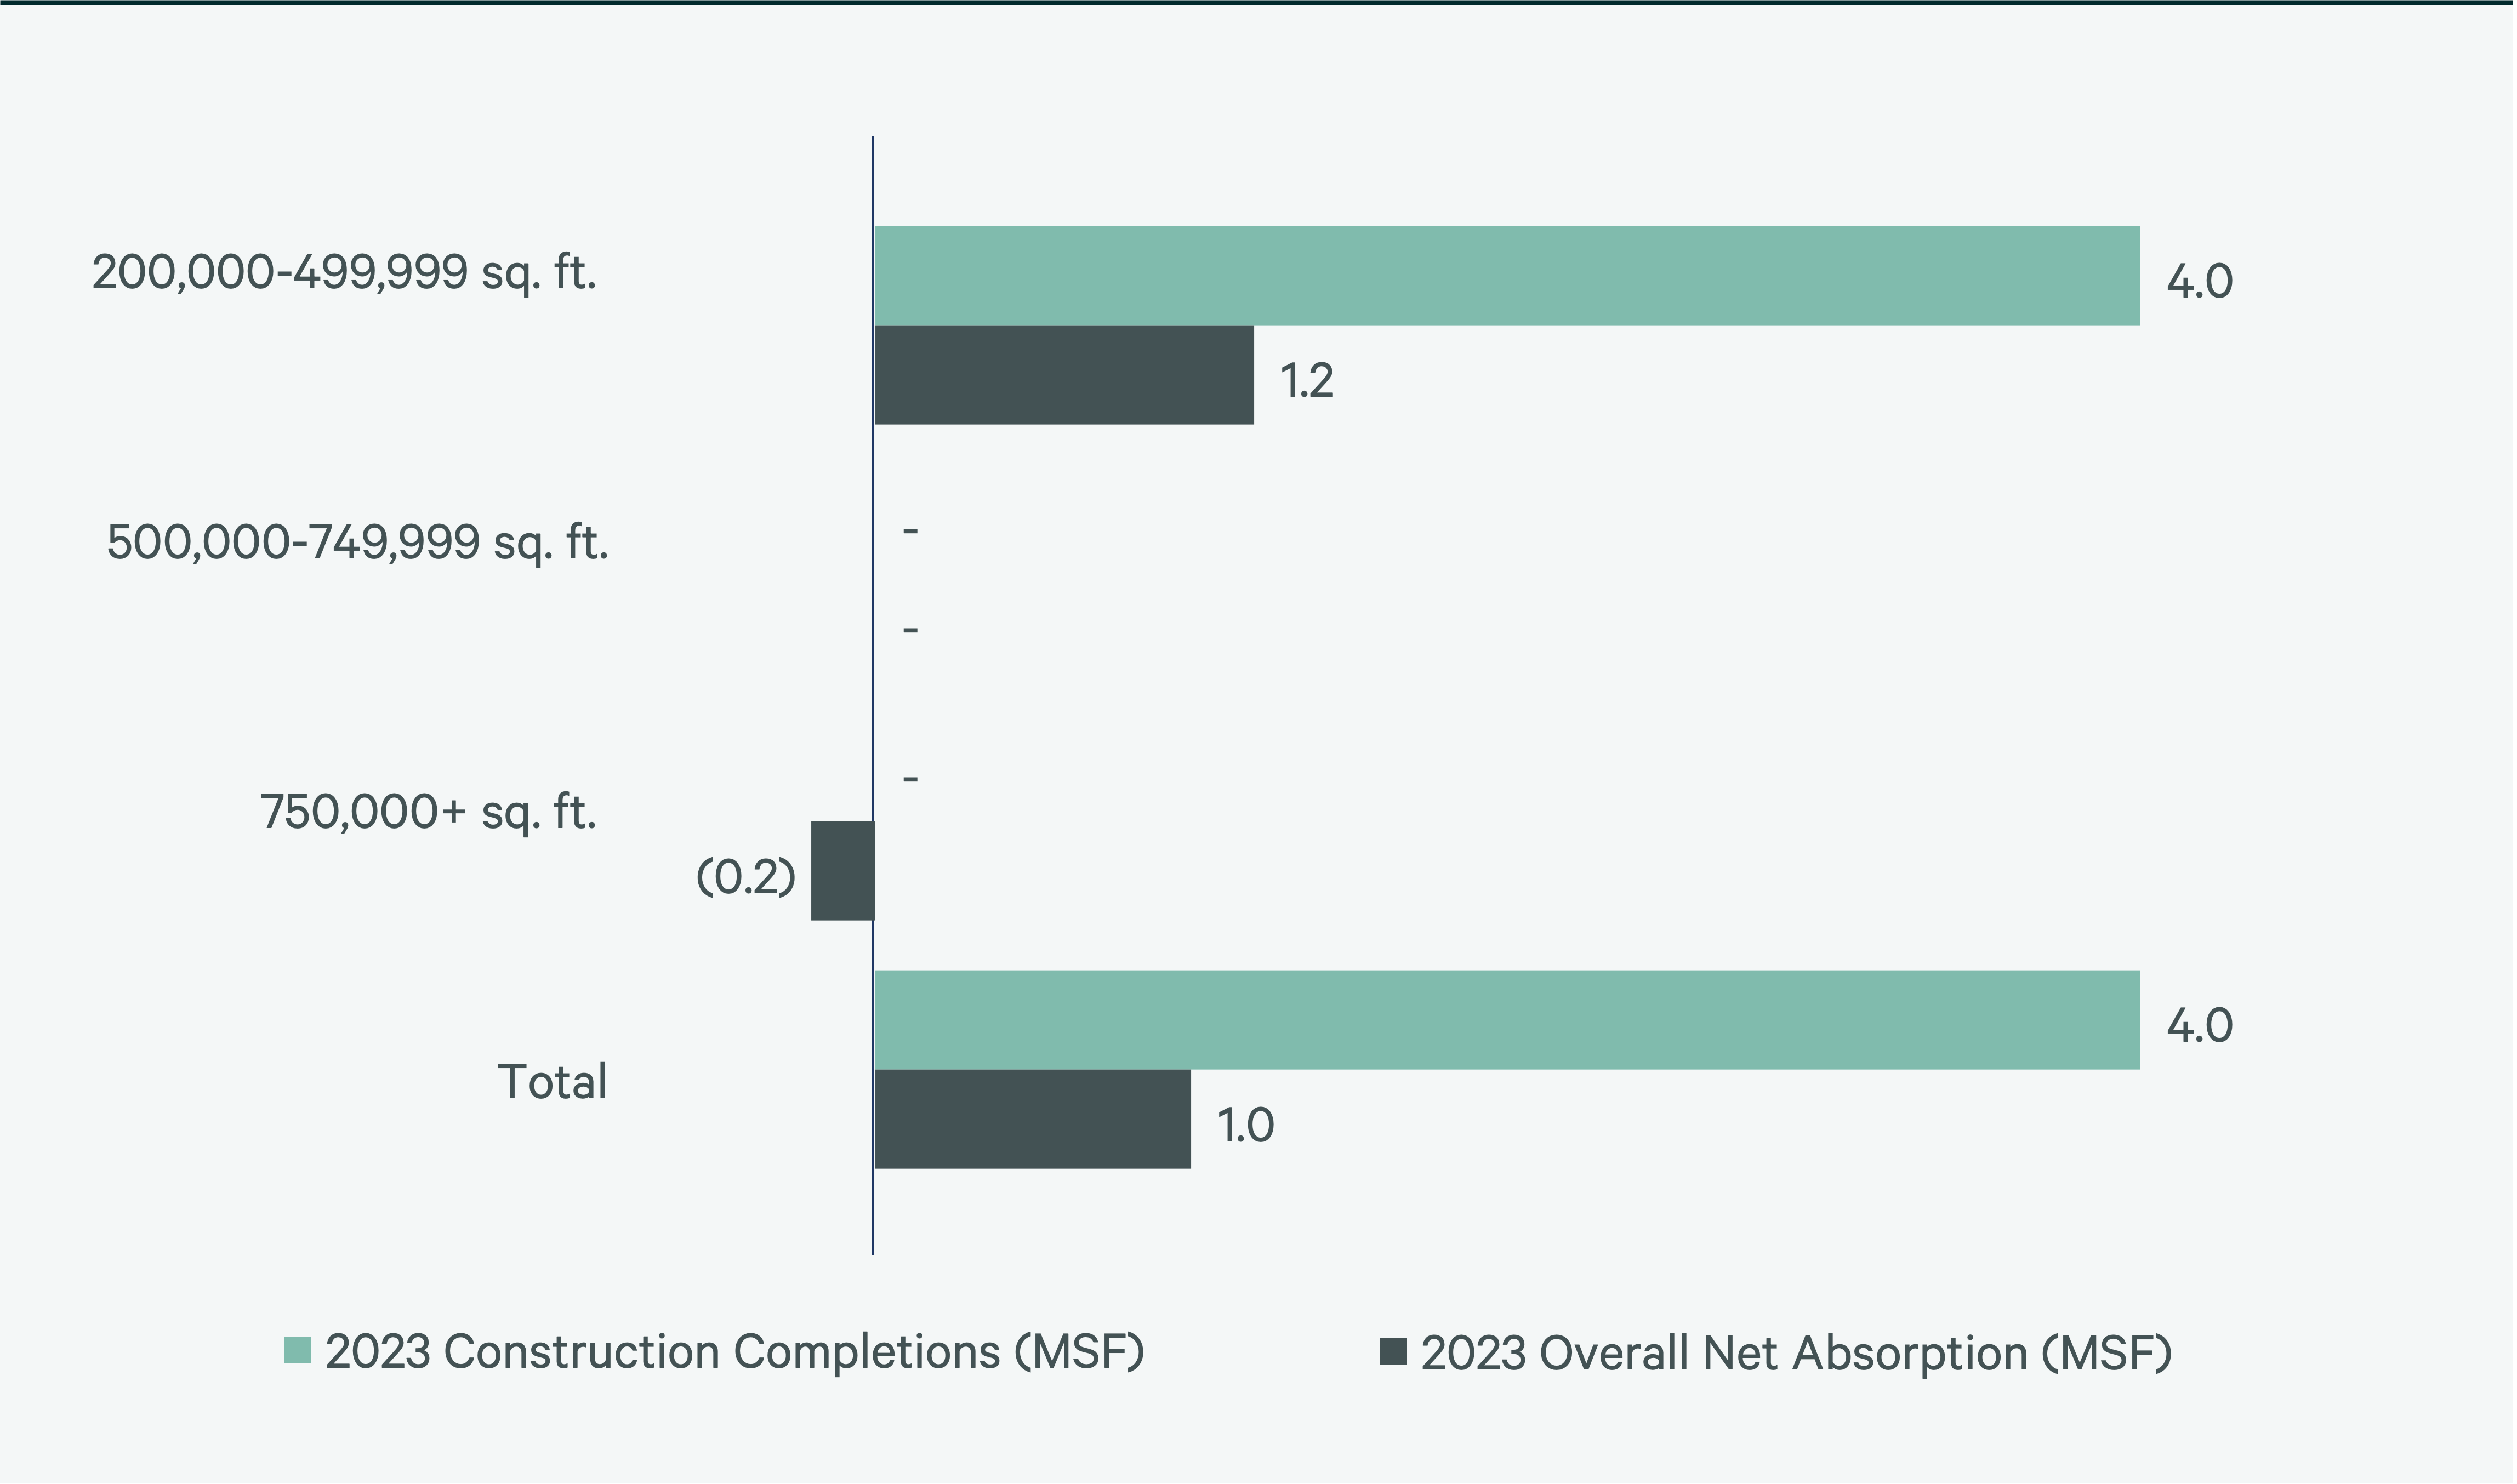
Figure 7: Direct Vacancy Rate by Size Range

Figure 8: Under Construction & Percentage Preleased

Figure 9: First Year Taking Rents (psf/yr)
Source: CBRE Research.
Explore Big-Box Insights by Market
-

Central Valley’s proximity to the affluent Bay Area gives it convenient access to more than 5.3 million people within 50 miles of the market’s core.
-

Around 11.9 million people live within 50 miles of the market’s core, the third-most of any U.S. market in this report, with a projected 0.4% five-year growth rate.
-

Over 15 million people live within 50 miles of the market’s core—the second-largest population of any U.S. market in this report, with a flat expected five-year growth rate.


